Media Coverage
 Press Release
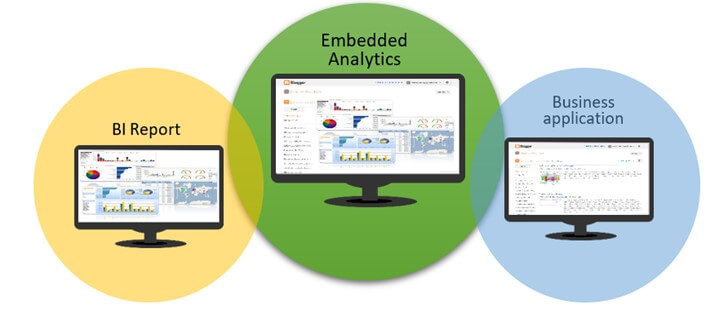
Data is valuable only if you can leverage it effectively. And to do that, you need to deliver insights to your users in a way that is convenient, contextual, and consistent. And one of the more effective ways of doing that is embedding analytics into software applications, websites, or portals.
In this blog, we will discuss what is embedded analytics, why it matters and how you can implement it using Tableau, one of the leading tools for data visualization and analytics. Plus, we will also share some additional resources to help you get started with embedded analytics.
Unleashing the Power of Embedded Analytics with Tableau
First, let’s begin by defining what is embedded analytics?
Embedded analytics refers to bringing together analytical assets and other software applications. It is the integration of customer-facing analytical content such as dashboards and visualizations into applications, portals, or websites. Embedding the content that leverages Tableau’s visual analytics capabilities and interactive functionality within existing and/or external applications, users can explore the data and make data-driven insights quicker and easier within an environment they are comfortable in.
Why Embedded Analytics?
Leveraging Analytics within Applications, Websites, and Portals
Empowering Users with Real-Time, Contextual Insights
As mentioned earlier Embedded Analytics offers many benefits. However, for the purpose of this blog, let’s identify some of main advantages it offers.
- Provides users with real-time, contextual analytics directly into their workflow.
- Effective embedded analytics ensures that the information is much more than just a snapshot. It allows the users to interact, filter and gain insights as needed right on the portal or application.
- Embedding analytics into existing business applications allows employees to get the benefits of the analytics without the need for extensive training on new platforms.
- Investing in embedded analytics also saves time with external stakeholders. Instead of needing to meet about alterations in requirements or data points frequently, both parties – internal and external, will have access to the same view. When these discussions do happen, they can be more judicious, relevant, and strategic. This contributes to speeding up processes and allowing more time for optimization.
- With row-level security in Tableau, an organization can restrict the data that is displayed according to the user logged in to their custom portal. This avoids the task of creating multiple, customized dashboards to meet security requirements. To see a Tableau view that’s embedded in a web page, the person accessing the view must also have an account on the Tableau site it is embedded from.
(Note: Embedded views follow the same licensing and permission restrictions used on Tableau Server and Tableau Cloud)
Advantages of Embedded Analytics for Effective Data Visualization
Seamless Data Exploration and Interaction
Simplified Integration into Existing Business Applications
Time and Cost Savings with Streamlined Workflows
Implementing Embedded Analytics with Tableau
Understanding Tableau’s Visualization Capabilities
Exploring Three Approaches to Embed Tableau Dashboards
Embedded analytics can have a plethora of prospective use cases. Here’s a list of just some use cases:
- Using an embedded dashboard as a stand-alone product.
- Embedding into CRM systems and knowledge bases.
- Embedding into custom mobile applications
- Adding interactive visualizations to blog posts and websites.
- Dashboards can also be embedded into SharePoint and Salesforce Lightning pages using specific requirements.
How to Implement Embedded Analytics?
Some pre-requisites of embedding a Tableau dashboard are:
- A Tableau Public, Tableau Server, or Tableau Cloud account.
- The Tableau dashboard content to be embedded should be published on one of the above.
- A text editor to create HTML files.
In this blog we will talk about three approaches to embed Tableau dashboards into a web page.
(Note: A production-embedded analytics application with Tableau is much more complex than what will be reported in this article. This article is meant to illustrate the basics of embedded analytics, so there is enough to get started.)
Approach 1: iframe + Tableau share link
Approach 2: Tableau JavaScript API
Approach 3: Tableau Embedding API
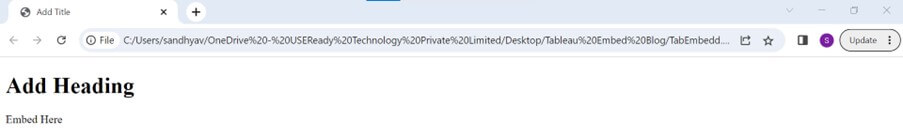
The first step, no matter which approach we follow, is to create an HTML script which will house the Tableau content. In the example explained, a simple HTML page will be created using a text editor.
We can use the below HTML snippet as a template. Save this template with a “.html” extension and open it in the browser.
<!DOCTYPE html>

<html>
<title>Add Title</title>
<body>

<h1>Add Heading</h1>
<p>Embed Here</p>

</body>
</html>
Initially, our basic webpage looks like below. We can always customize and add more design using front-end technologies like CSS, ReactJs etc.
Now let’s explore the three approaches mentioned earlier to embed a dashboard in a webpage.
Approach 1: iframe + Tableau share link
The first method of embedding a Tableau dashboard into a simple webpage is through an inline frame tag called <iframe>. On Tableau Server / Tableau Public, go to the dashboard you want to embed and click the ‘Share’ icon. A popup window opens where we can copy the link.
In the HTML file add an <iframe> tag between the body tags. The “src” attribute equates to the link we copied from Tableau Public. Save the file and refresh the browser.
<!DOCTYPE html>
<html>
<title>Embedded Tableau</title>
<body>
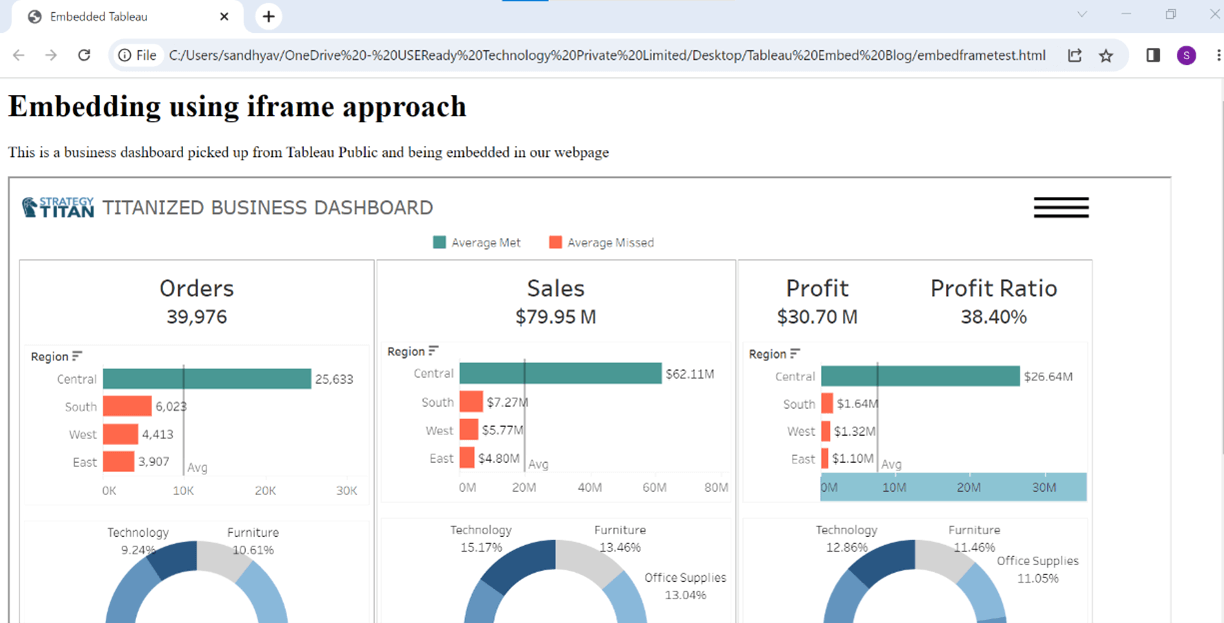
<h1>Embedding using iframe approach</h1>
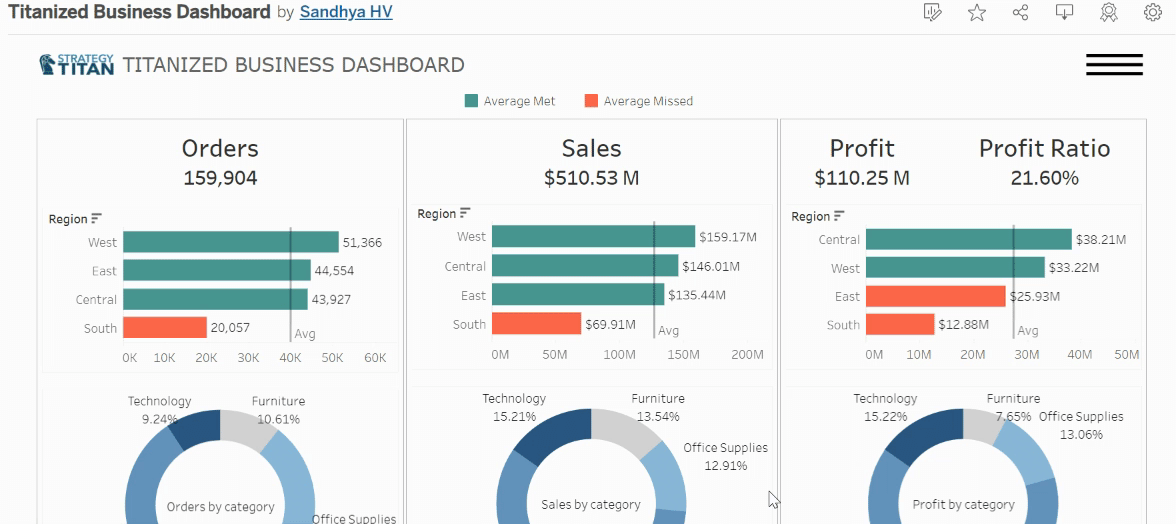
<p>This is a business dashboard picked up from Tableau Public and being embedded in our webpage
</p>
<iframe src="https://public.tableau.com/views/TitanizedBusinessDashboard/Monitor?:language=en-US&:toolbar=n&:display_count=n&:origin=viz_share_link">
</iframe>
</body>
</html>
Initially, Tableau does not connect to the interactive dashboard and show the viz. The webpage looks like this:
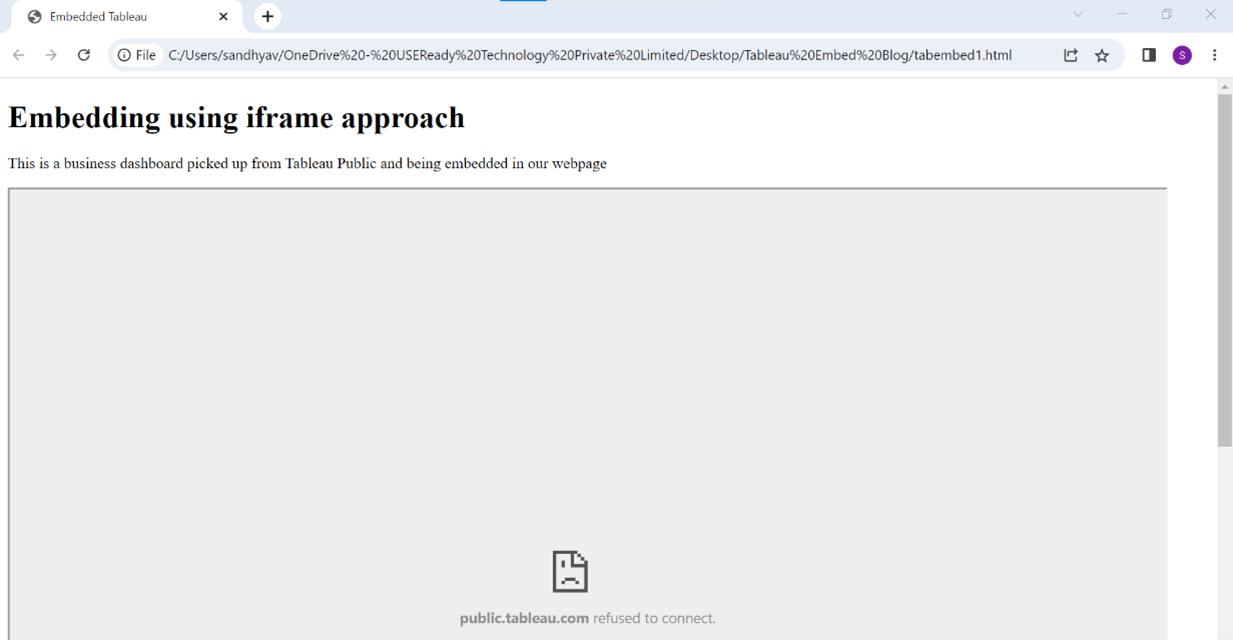
This is due to ClickjackProtection being enabled by default on Tableau products to eliminate attacks via Clickjacking or UI Redressing. This prevents the content from being loaded into an <iframe> element.
Although this can be overridden, ClickjackProtection must be left enabled for better security. The simplest way to override the protection is by shortening the Tableau server/public link to avoid any unnecessary URL functions causing this. We should also include the function embed=true. Replace the “src” attribute with below.
src="https://public.tableau.com/views/TitanizedBusinessDashboard/Monitor?:showVizHome=no&:embed=true "Tableau now connects to the public dashboard and loads successfully.
Clickjack Protection is one of the main reasons for only using public data on public websites for iframe embedding. This is not recommended for dashboards with security, or which include sign-on.
Approach 2: Tableau JavaScript API
Tableau JavaScript API gives more control over the embedded Tableau dashboard. This method allows both the web page and the embedded Tableau dashboard to interact with each other. This method can be used on Tableau Server, Tableau Cloud, or Tableau Public.
For this method, we will have to have two files. One being our existing HTML file and the other is a JavaScript file from which the dashboard is rendered. These two files are linked to each other by div id and the function name. Essential elements to note here are:
- Tableau public JavaScript API: ‘https://public.tableau.com/javascripts/api/tableau-2.js.’ This is inserted in the HTML file.
- Tableau public dashboard URL.
HTML file:
<!DOCTYPE html>
<html>
<title>Embedding Tableau </title>
<head>
<script type='text/javascript' src=`https://public.tableau.com/javascripts/api/tableau-2.js`></script>
<script type='text/javascript' src=`tableauembed.js`></script>
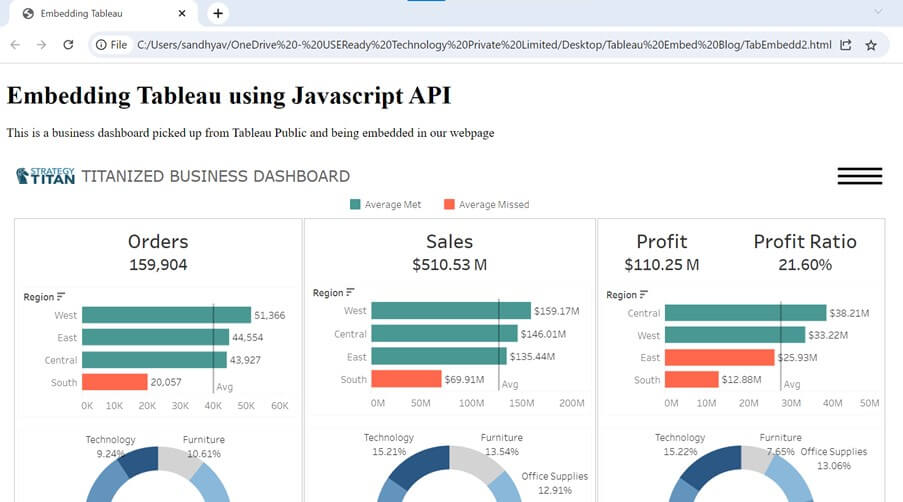
<h1>Embedding Tableau using Javascript API</h1>
<p>This is a business dashboard picked up from Tableau Public and being embedded in our webpage</p>
</head>
<body onload="initViz();">
<div id=”tableauViz”></div>
</body>
</html>
JavaScript file:
function initViz() {

    var containerDiv = document.getElementById("tableauViz");
    url = "https://public.tableau.com/views/TitanizedBusinessDashboard/Monitor?:language=en-US&:toolbar=n&:display_count=n&:origin=viz_share_link&:jsdebug=n";

    var viz = new tableau.Viz(containerDiv, url);

}
Save these two files in the same folder and refresh the browser. The webpage loads successfully.
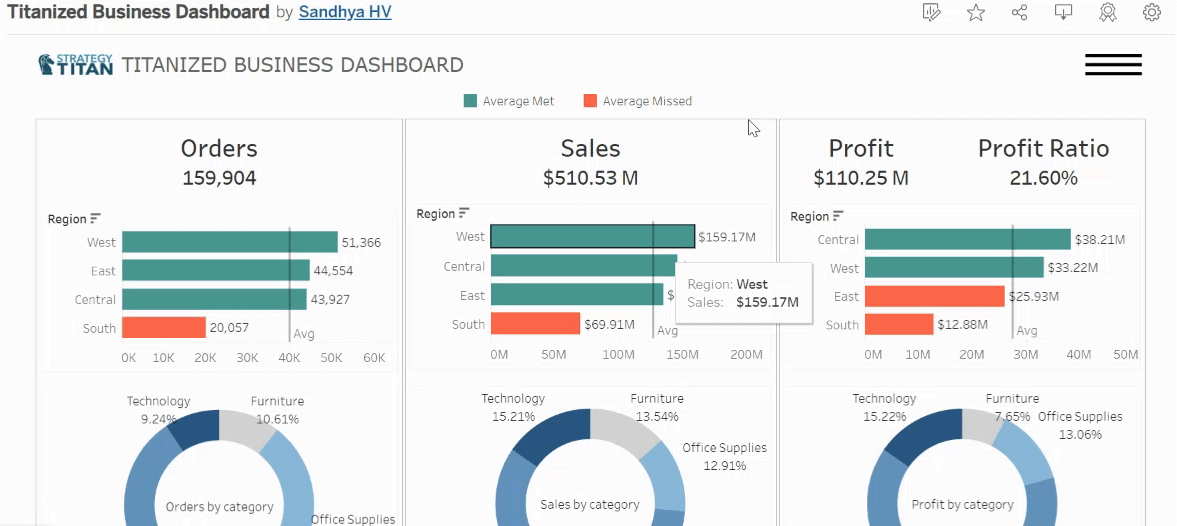
JavaScript approach can be tied to any number of other objects such as filters or actions inside the Tableau embedded analytics application. The Embedding API, which we’ll discuss next, has many of these same capabilities for communication with the page and beyond.
Approach 3: Tableau Embedding APIs
The latest and most streamlined method of embedding Tableau Dashboards is using the Tableau Embedding API. It is an extension and upgrade of the JavaScript API v2. Starting with the Embedding API is a good idea if we are trying to embed Tableau for the first time and looking to learn more.
On Tableau Server / Tableau Public, go to the dashboard you want to embed and click the ‘Share’ icon. A popup window opens; copy the Embed code.
In the HTML file, place this embed code between the body tags. Save the file and refresh the browser.
<!DOCTYPE html>
<html>
<title>Embedded Tableau</title>
<body>
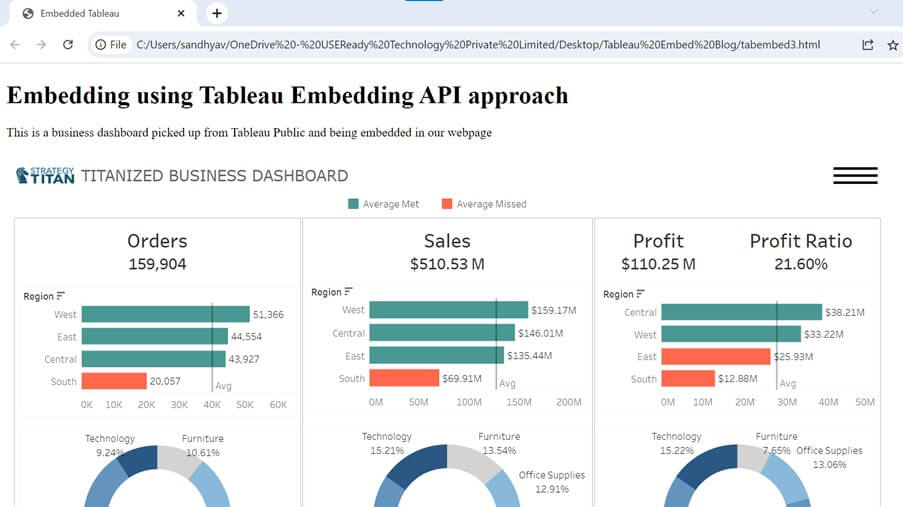
<h1>Embedding using Tableau Embedding API approach</h1>
<p>This is a business dashboard picked up from Tableau Public and being embedded in our webpage</p>
<!--Place embed code as below-->
<div class='tableauPlaceholder' id='viz1688453106140' style='position: relative'><noscript><a href='#'>
<img alt='Monitor ' src='https://public.tableau.com/static/images/Ti/TitanizedBusinessDashboard/Monitor/1_rss.png' style='border: none' />
</a></noscript>
<object class='tableauViz' style='display:none;'>
<param name='host_url' value='https%3A%2F%2Fpublic.tableau.com%2F' />
<param name='embed_code_version' value='3' /> <param name='site_root' value='' />
<param name='name' value='TitanizedBusinessDashboard/Monitor' />
<param name='tabs' value='no' />
<param name='toolbar' value='no' />
<param name='static_image' value='https://public.tableau.com/static/images/Ti/TitanizedBusinessDashboard/Monitor/1.png' />
<param name='animate_transition' value='yes' />
<param name='display_static_image' value='yes' />
<param name='display_spinner' value='yes' />
<param name='display_overlay' value='yes' />
<param name='display_count' value='yes' />
<param name='language' value='en-US' />
</object>
</div>
<script type='text/javascript'>
var divElement = document.getElementById('viz1688453106140');
var vizElement = divElement.getElementsByTagName('object')[0];
if ( divElement.offsetWidth > 800 ) { vizElement.style.width='1130px';vizElement.style.height='600px';}
else if ( divElement.offsetWidth > 500 ) { vizElement.style.width='1130px';vizElement.style.height='600px';}
else { vizElement.style.width='100%';vizElement.style.height='1850px';}
var scriptElement = document.createElement('script');
scriptElement.src = 'https://public.tableau.com/javascripts/api/viz_v1.js'; vizElement.parentNode.insertBefore(scriptElement, vizElement);
</script>
</body>
</html>
Our webpage now includes a fully interactive dashboard.
Enhance Your Knowledge with Additional Resources
This was just a basic demonstration of how a Tableau dashboard can be embedded in a simple webpage. This can be augmented with many functionalities such as Single Sign-on, Authentication, Embedding Web Authoring, Embedding Ask Data and more.
Here are some resources that can be very helpful while learning about Tableau Embedded Analytics.
Learning about Tableau Embedded Analytics Overview
To know more about overview of Embedded Analytics that Tableau offers:
https://help.tableau.com/current/pro/desktop/en-us/embed_landing.htm
Developer Resources for Tableau Embedded Analytics
For developer learning resources on Tableau Embedded Analytics:
https://www.tableau.com/developer/learning
Tableau Embedding Playbook and Interactive Playground
Here is a Tableau Embedding Playbook:
https://tableau.github.io/embedding-playbook/
Detailed overview on Tableau Embedding APIs. This also has a tutorial that can be followed along.
https://help.tableau.com/current/api/embedding_api/en-us/index.html
This is a real interesting one! A Tableau Embedding Playground – an interactive learning environment for rapidly developing embedded analytics solutions – where you can get your hands dirty and get embedding!
https://developer.salesforce.com/tools/tableau/embedding-playground