


 Media Coverage
 Press Release
Advanced Report Design Techniques for Power BI Paginated Reports
Enhancing Interactivity: Creating Dynamic Reports in Power BI
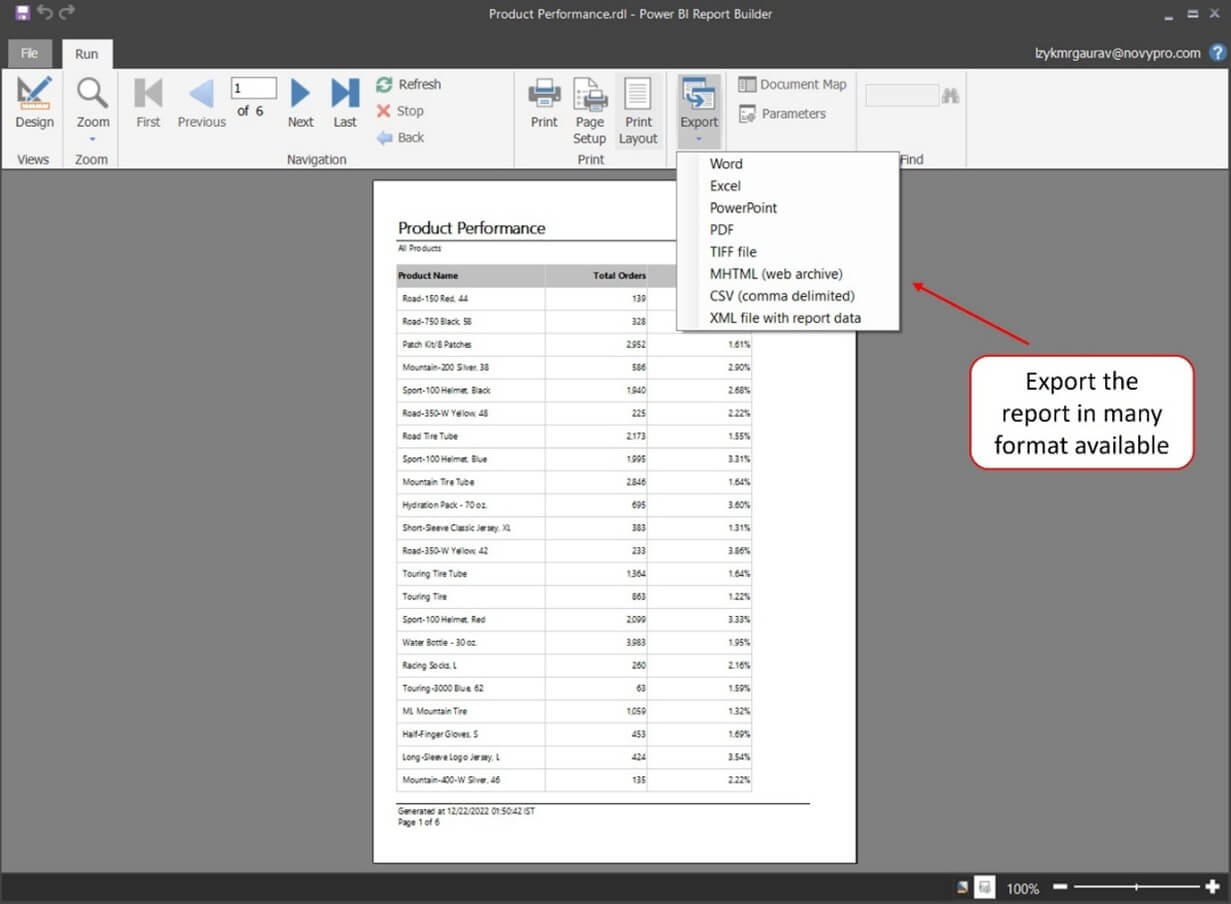
Paginated Reports are designed for pixel-perfect printing. They are same as SSRS, which have come to Power BI with advanced features for enhancing reporting capabilities. They are well designed & formatted reports which are highly customized and gives functionality to work with every aspect of page properties like text size, colours, spacing, and print layout. Also, gives us flexibility to insert images and charts as well. Paginated Reports can be exported in many file formats pdf, excel etc. With a free license, you can publish paginated reports to My Workspace in the Power BI service. You do need a PPU or Power BI Pro license and contributor access to publish to other workspaces. Users with free, Pro, and PPU licenses can view the content.
Understanding the Power of Paginated Reports in Power BI
Customizing Report Layouts for Flexibility and Adaptability
Leveraging Parameters for Dynamic Report Generation
Implementing Interactive Features for Enhanced User Experience
Designing Flexible Layouts: Tips and Best Practices
Dynamic Report Generation: Strategies for Effective Parameter Usage
Enhancing User Engagement: Interactive Elements and Navigation Controls
Optimizing Performance: Techniques for Efficient Paginated Reports
Let’s have a look at the flow of creating and exporting a Paginated Reports.
How to create a Paginated Report?
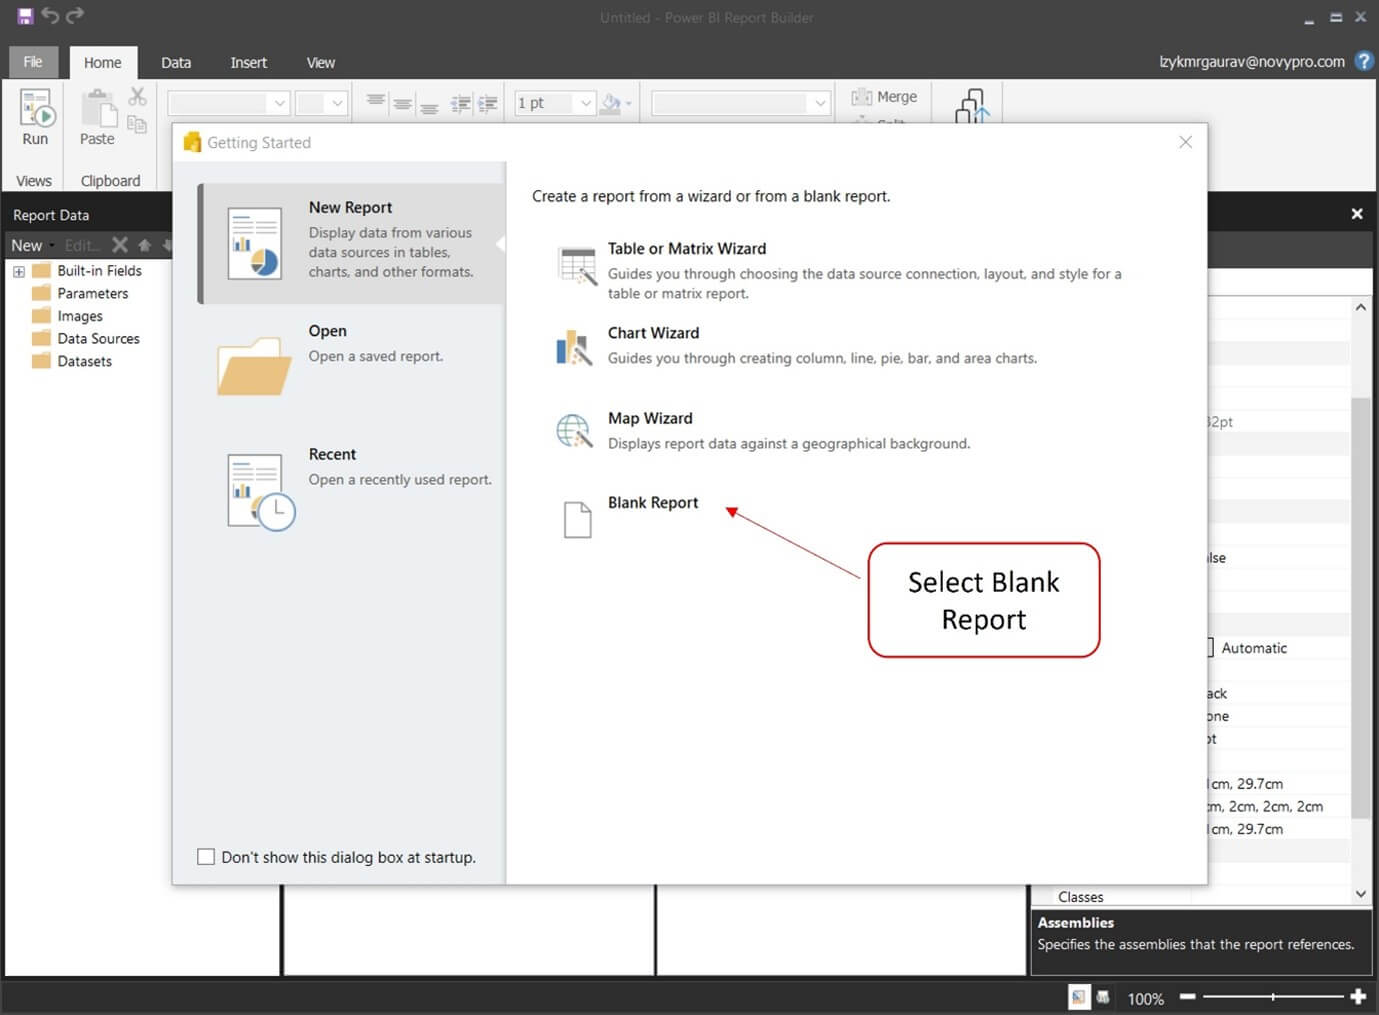
1. Open Power BI Report Builder
First, we need to open Power BI Report Builder; you will see the below window. In this one, we can select Table Wizard/ Chart wizard/ Map Wizard / Blank Report. Here we will select Blank Report.
2. Create and Configure Data Source
a. After selecting the Blank report, Create the Data source to connect with Dataset you have already created and published in the workspace:
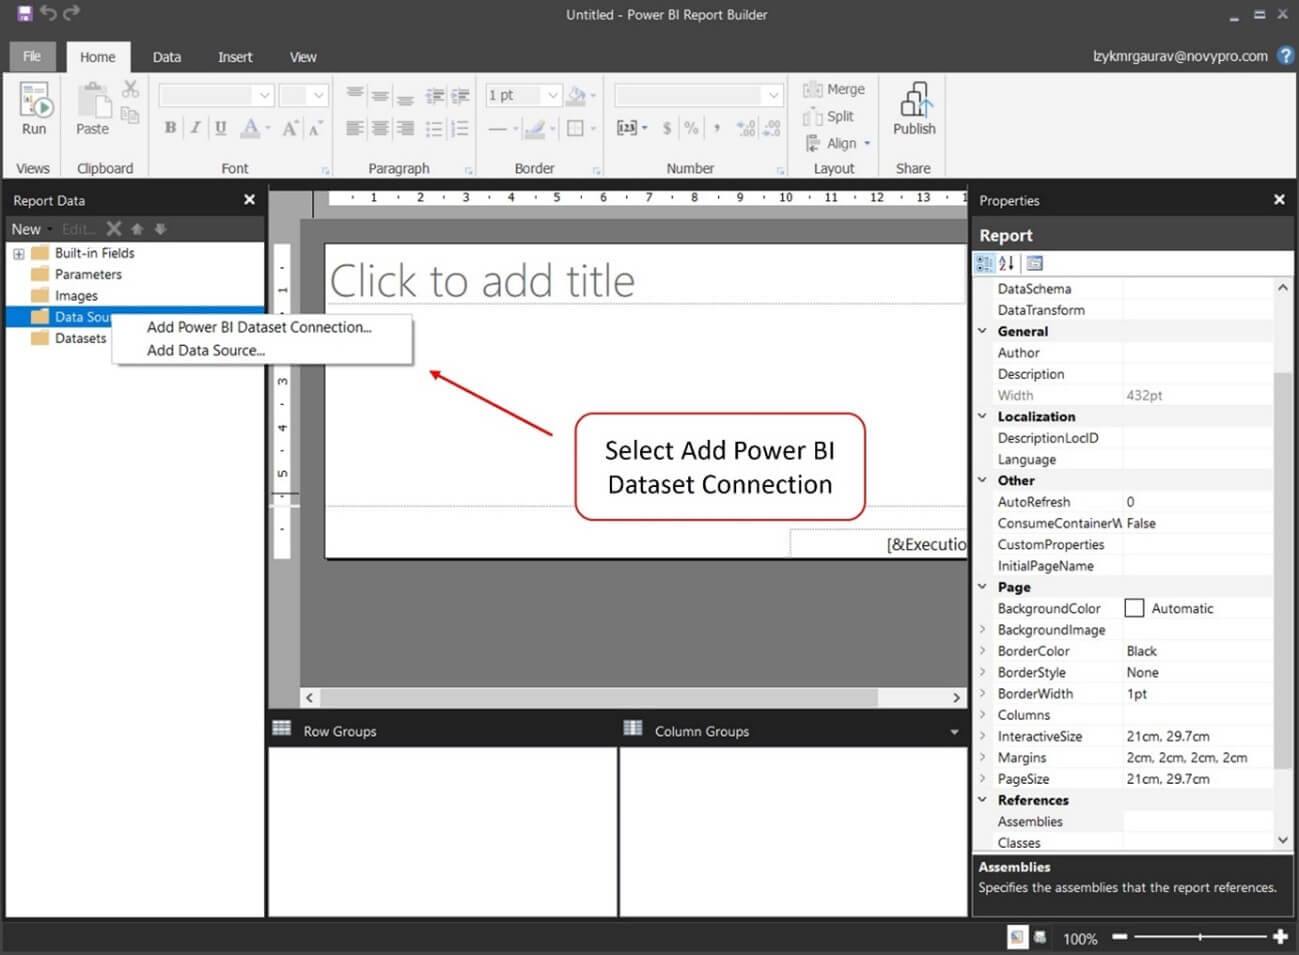
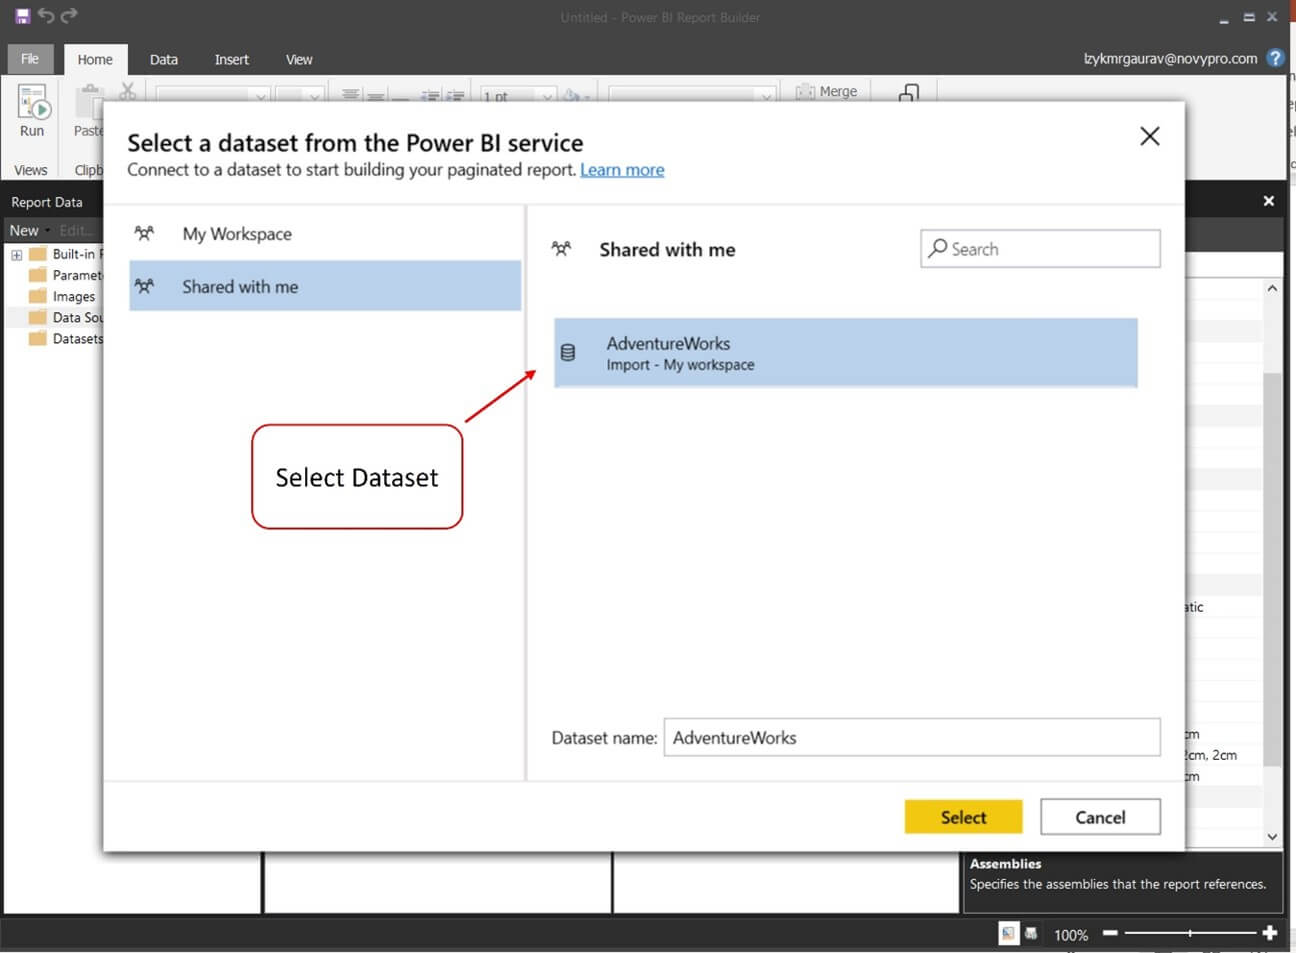
b. Select the Power BI dataset available and create the Data source connection (Select the highlighted one Dataset):
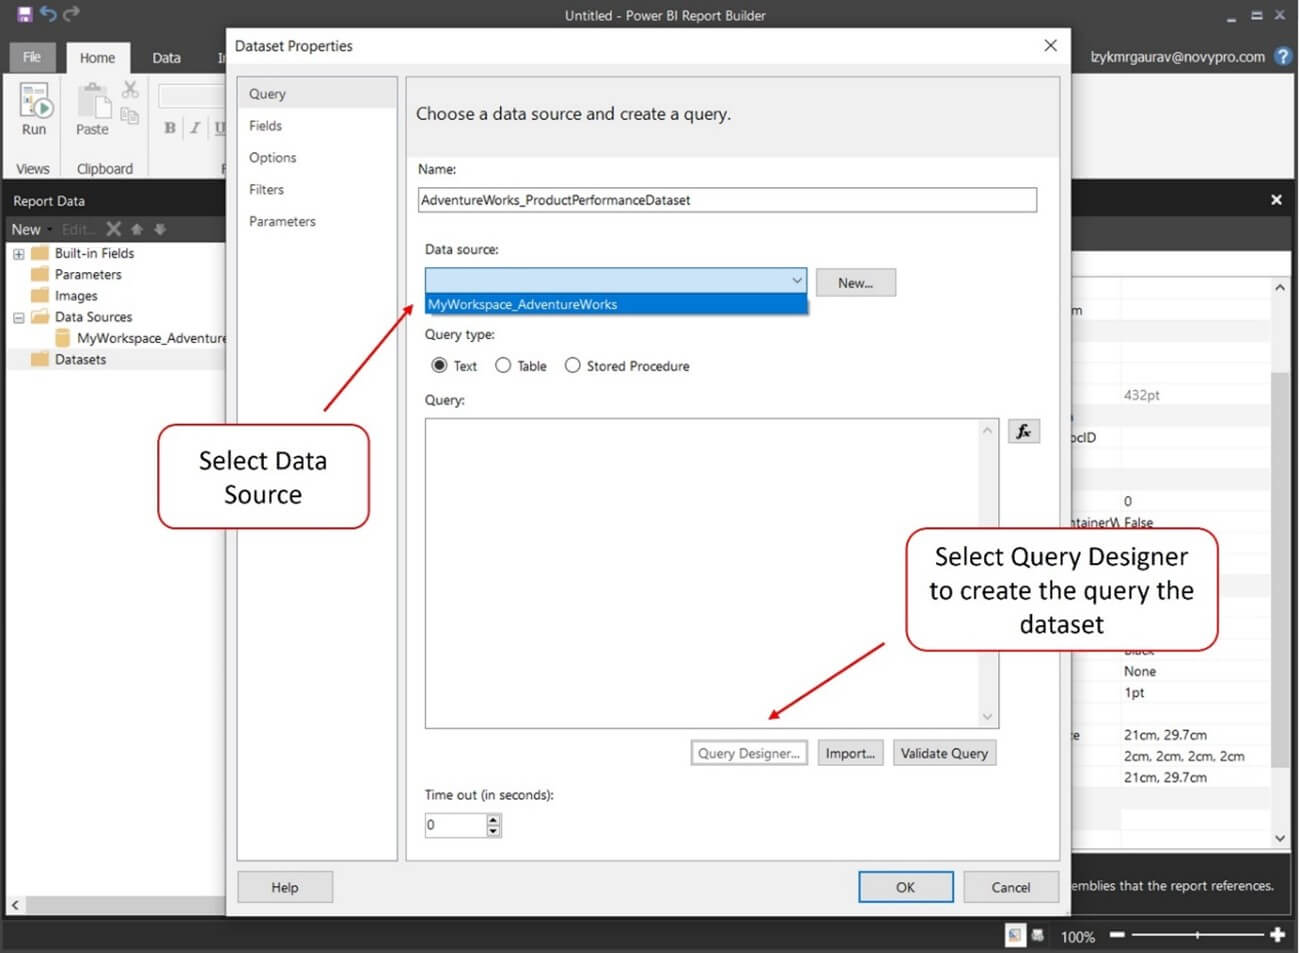
3. Create a Dataset for the report
a. After creating the Data source, we need to make the Dataset for the report. When you click on Add Dataset, the below Dataset Properties Window appears; here, we will give the appropriate name to the Dataset and select the Data source we have already created.
b. Now we need to select the columns for the design view and get the parameters in the parameters pane:
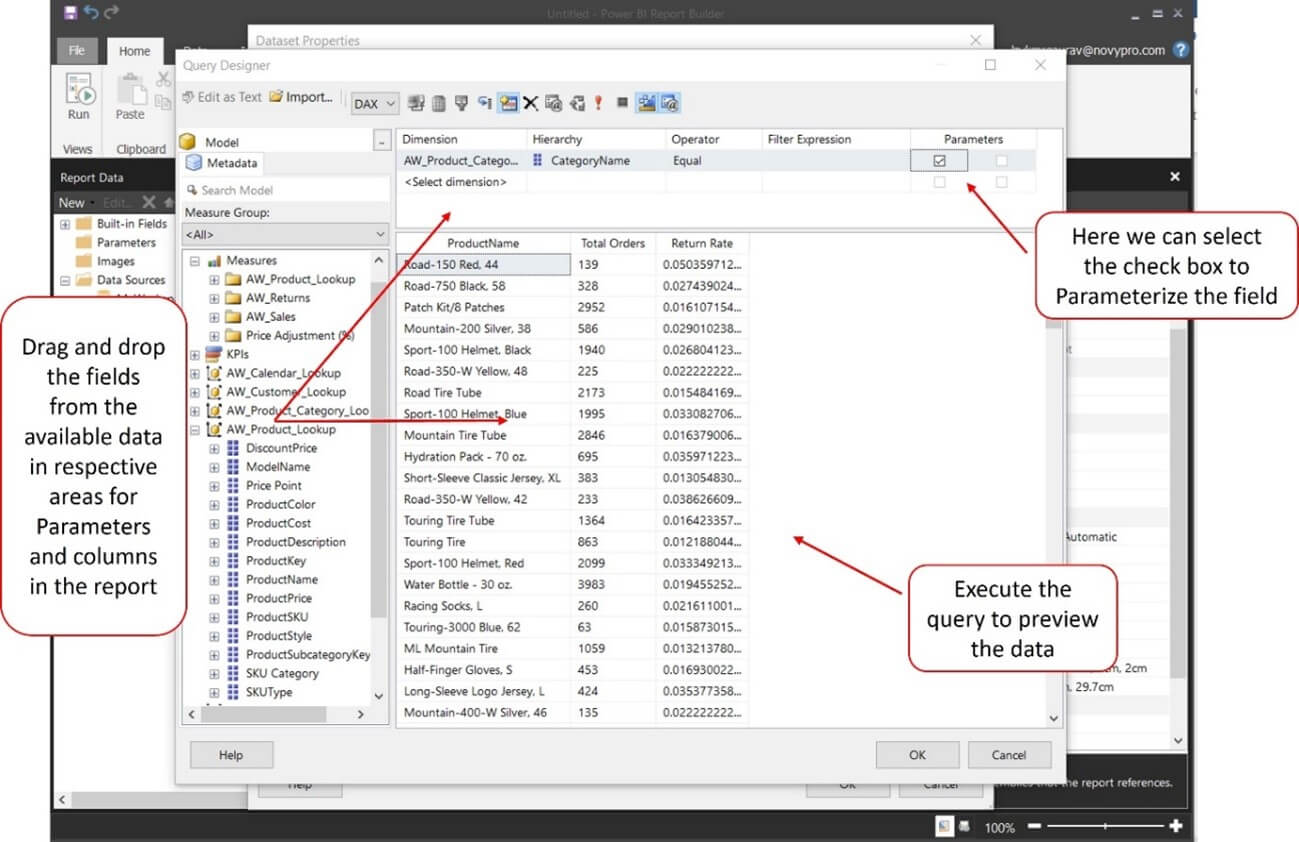
c. Now Click on OK, and you will see the query created in the Query Designer. Again, click on Ok, and we can go ahead to make the table on the Report Page.
4. Create the Paginated Report
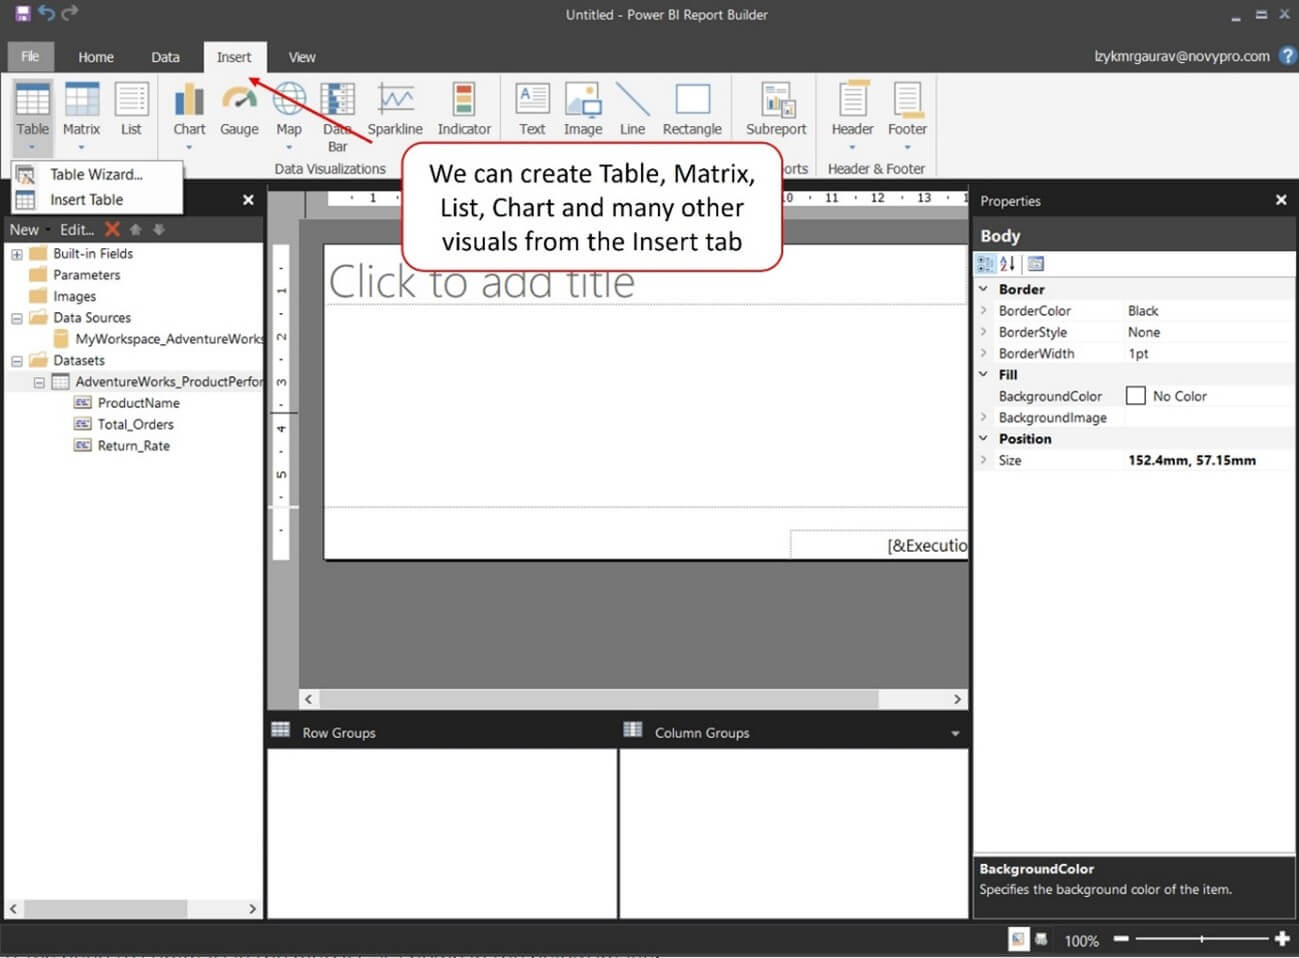
a. Let’s create the table from the Table Wizard:
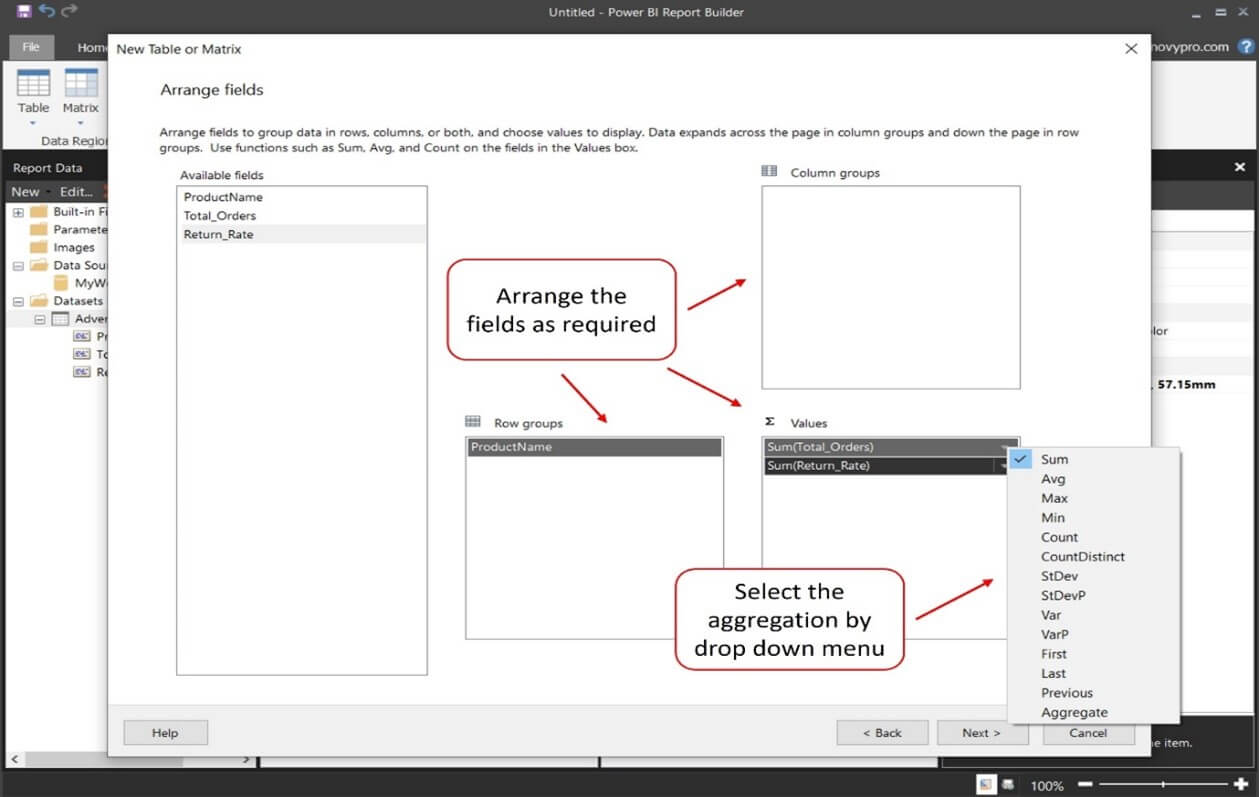
b. After clicking on Table Wizard, you will see the window to choose the Dataset which already exists or the one you have already created before this step. After selecting the existing Dataset, the next step will be the Arrange Fields. In this, we need to drag the columns for Value, Row group, and Column Group pane as below. Also, we need to summarize the metrics as shown in the below image:
c. Click on Next and Finish, and the table will be created on the Report Page. Then you can do some formatting as per the Client’s Requirement to get the final Report. We can use Properties for formatting purposes.
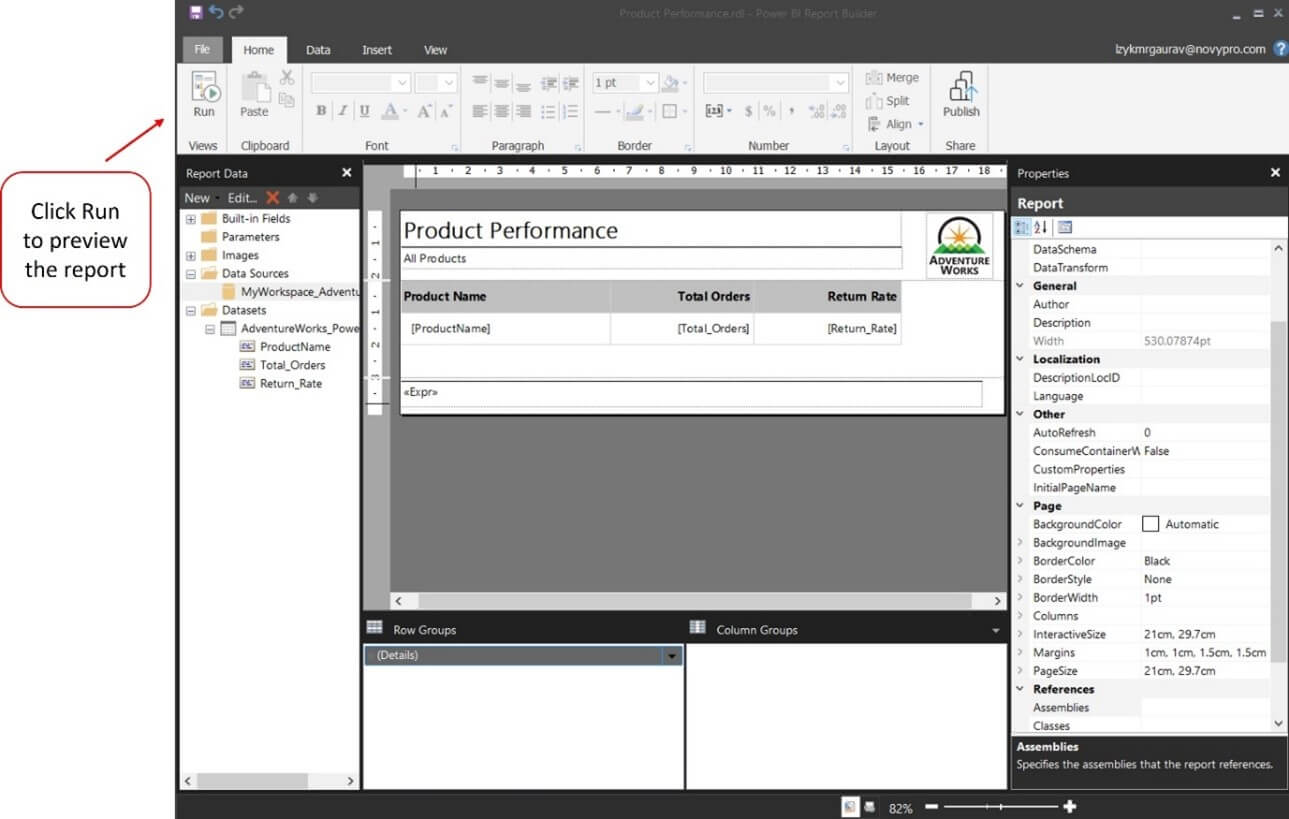
5. Output the Paginated Report
To see the output of the report, we need to “Run” the Report from the Home Tab.
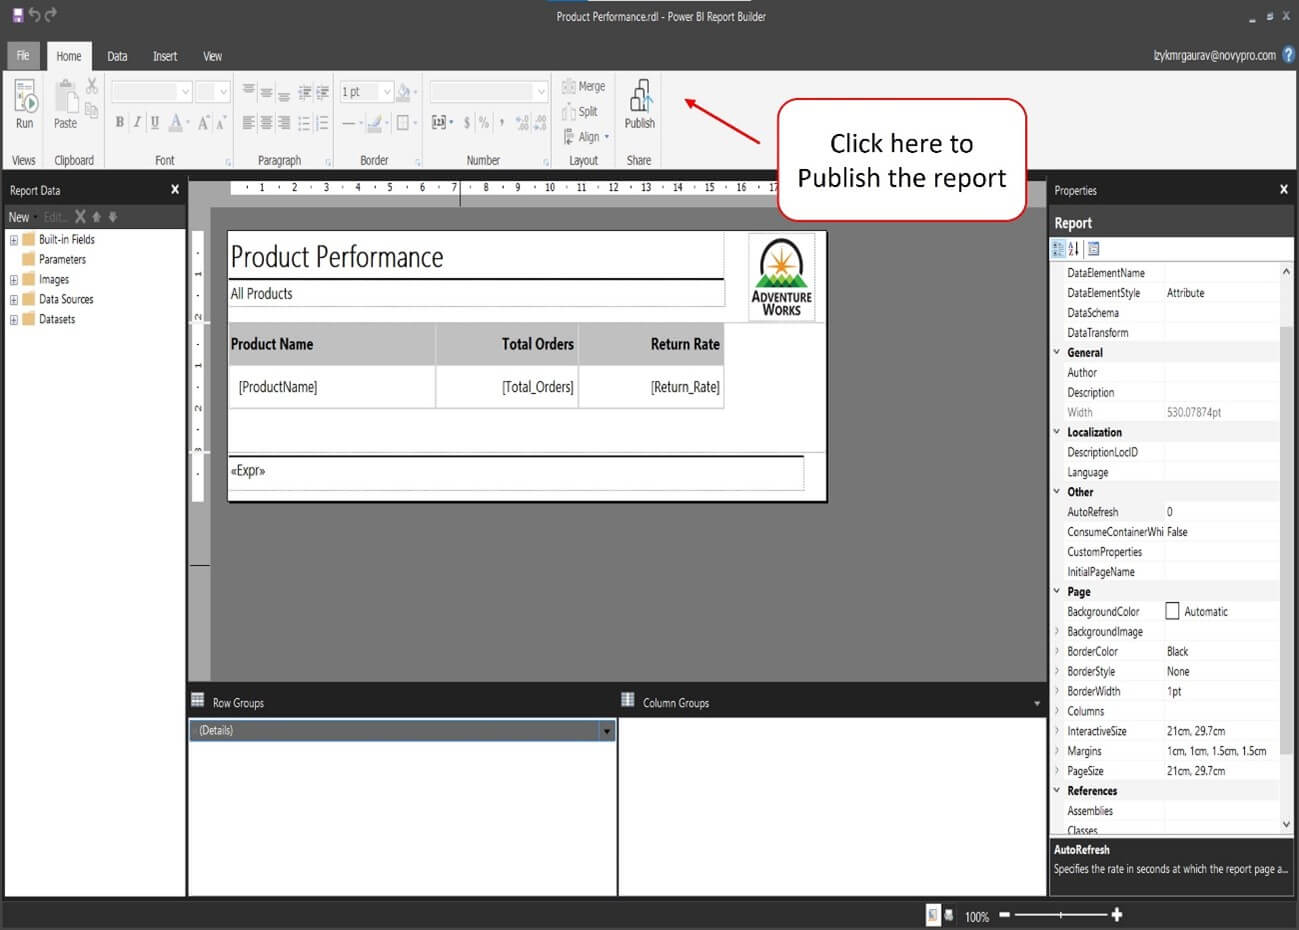
6. Publish the report
To publish the report on the Workspace in Power BI Service. The user can view the report on the Power BI Service and can download the report from the Power BI Service as well.
Under Home Tab click on “Publish” to host the report on Power BI Service Workspaces.
Conclusion
As an author Paginated Report can help you create a print-ready report that will generate a highly customized printable report that’s fulfil the business requirements.
Pixel Perfect – https://www.useready.com/product/pixel-perfect/
