Power BI Paginated Reports: Designing Customizable and Dynamic Reports
Getting Started with Paginated Reports in Power BI
Creating Interactive and Flexible Reports with Power BI Paginated Reports
Have your stakeholders ever raised a ticket that when they are printing a table or matrix in the Power BI report it does not fit on the page or doesn’t have the ability to keep/print the all the records that are in the table or matrix? Then the options are limited and i.e., Power BI Paginated Report.
What is Paginated Report in Power BI?
Paginated Reports are designed for pixel-perfect printing. It is created using a different tool i.e., Power BI Report Builder and has different use case. They are ideal for exporting into excel or pdf format for sharing purpose and printing especially when data is presented in the multiple pages such as a table or matrix with hundreds and thousands of rows. They are called paginated because they are formatted to fit well on a page. They allow users to fine-tune each field of the report, such as text size, colours, spacing, and print layout, in a more precise way than using regular visuals in Power BI Desktop. One can set page headers and footers and categorize them so that certain information goes into certain report pages.
Introduction to Power BI Paginated Reports
Understanding the Components of Paginated Reports
Designing Interactive and Customizable Report Layouts
Implementing Dynamic Features for Enhanced User Experience
Overview of Paginated Report Layouts and Design Options
Step-by-Step Guide to Creating Dynamic Report Elements
Enhancing User Interaction: Tips for Effective Report Navigation
Best Practices for Designing Interactive Power BI Paginated Reports
Paginated Reports are the same as SSRS, which have come to Power BI with advanced features for better reports. With a free license, you can publish paginated reports to My Workspace in the Power BI service. You do need a PPU or Power BI Pro license and contributor access to publish to other workspaces. Users with free, Pro, and PPU licenses can view the content.

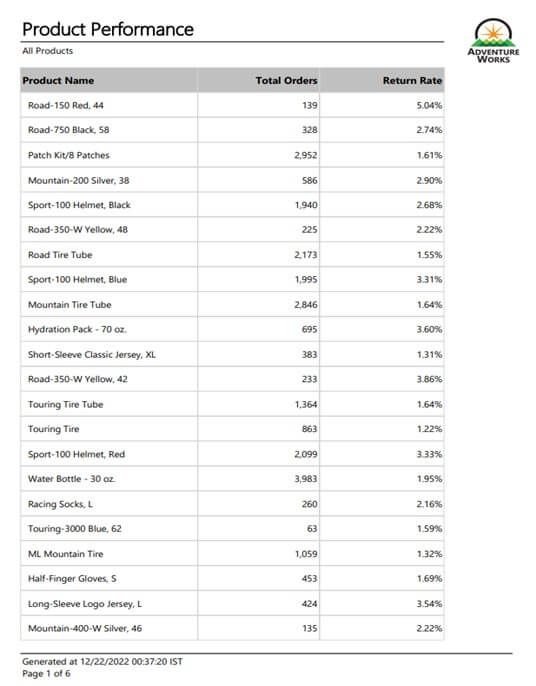
Fig 1: Power BI Paginated Report Sample
Features of Paginated Reports
With Power BI Report Builder you can preview the report before you publish it to the Microsoft Power BI service. Here are a few features of Power BI Report Builder that give you an idea of everything you can accomplish with it:
- Data Modification: You can group, filter, and sort data for your Paginated Reports while using Power BI Report Builder. It also allows you to add formulas and expressions to the reports.
- Report Modification: Power BI Report Builder allows you to update and customize the reports that you create with the SQL Server Data Tools (SSDT) Report Designer.
- Reporting from Multiple Sources: It allows you to create reports that draw relational and multidimensional data from various sources like SQL Server and Analysis Services, Power BI datasets, Oracle etc.
- Multiple Layouts: You can create Paginated Reports for matrix reports, column-based data for summarized data, chart reports for graph-based data, and free-form reports for everything else. The reports can contain other charts and reports along with lists, graphics, and controls for dynamic web-based applications.
- Interactive Features: You can add numerous interactive features to your reports like gauges, charts, sparklines, indicators etc.
Comparison between Power BI Report and Paginated Reports
These two reports are hosted in Power BI service but are generated for different purpose and have different capabilities. Here is a summary of a few differences:
| Power BI Report | Paginated Reports | |
| Creation Tool | Power BI Desktop, Power BI Service | Power BI Report Builder |
| Learning Curve | Easy | Difficult |
| License | Free, Pro, Premium, PPU | Free (My Workspace) and Pro or PPU (Other Workspaces) |
| Ideal for | Interactive analytical reports | Pixel-perfect print ready reports |
| Design Process | Powerful and user-friendly UI of Power BI Desktop | Powerful but not much user-friendly i.e., more developer focused UI of Report Builder |
| File extension | .pbix | .rdl |
Table 1: Comparison between Power BI Report and Paginated Report
Why does Paginated Reports exist?
Power BI paginated reports are optimized for printing, or PDF generation. They also provide you with the ability to produce highly formatted, pixel-perfect layouts which makes paginated reports an ideal choice for operational reports like invoices., bills etc.
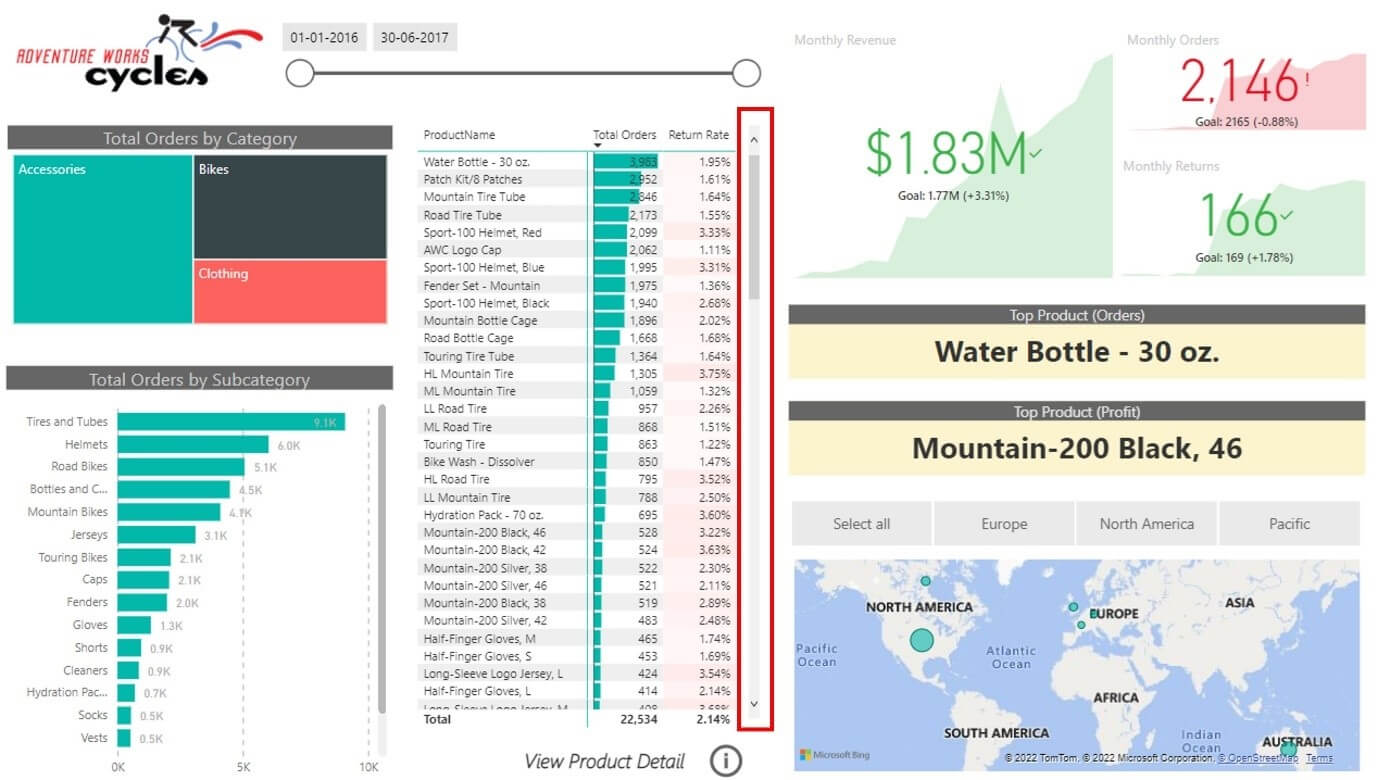
Let’s understand how printing works in normal Power BI report. A table visual in the Power BI report comes with scroll bar. Only a few records can be visible on the screen. You need to scroll down or put a filter on the report or visual to get the records you want.

Fig 2: Power BI Report Sample
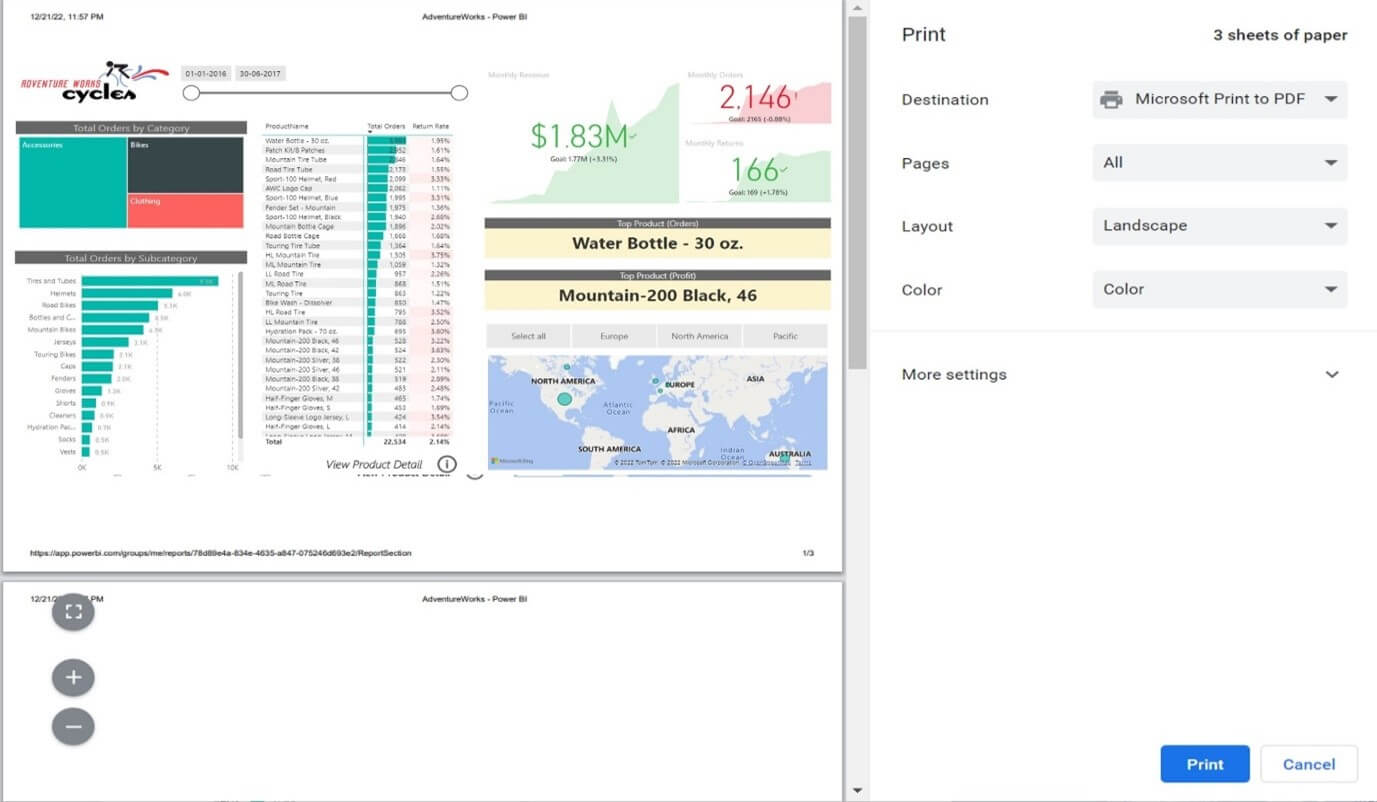
However, if you want to print the report then the printed version of the report will have some extra noise elements on the page as well. Printing of a Power BI report table or matrix content is not just a simple task. To reach out the format of your requirement, you need a tool which can easily integrate with all the aspects of the printable or pixel perfect report. To solve this problem, you need Power BI paginated reports. A paginated report can be designed exactly as you want to print it in the output.

Fig 3: Printed Version of the Power BI report
Conclusion
Paginated reports are pixel-perfect print-friendly reports. These reports are designed using Power BI Report Builder. They are not usually as interactive as the normal Power BI reports, but they serve perfectly for printing.
- It helps to create tabular reports, sales invoices, credit card bill etc.
- It is more customized and gives functionality to work with every aspect of a page properties and comes with interactive parameters.
- Offers graphic interface for Query Designer to get the queries written and preview the data before loading.
- Optimized for Printing or to export in many other popular formats like excel, pdf etc.
In the next part we will cover “Step by Step guide to create Paginated Report”
Pixel Perfect – https://www.useready.com/product/pixel-perfect/


 Media Coverage
 Press Release
