


 Media Coverage
 Press Release
Enhancing Marketing Intelligence with Datorama’s Custom Reports
Marketing intelligence is essential for marketers to stay ahead of the competition and deliver the best results. However, deriving marketing intelligence can be tough without the right tools and platforms. That’s why many marketers turn to Datorama, a powerful marketing intelligence platform which helps them connect their data sources, automate reporting, visualize insights, and optimize campaigns.
Introduction to Datorama’s Marketing Intelligence Platform
The Power of Custom Reports for Marketers
One of the ways that Datorama can help marketers is by allowing them to create custom reports that match their unique needs and objectives. Custom reports can allow marketers to customize their data analysis and presentation to their specific questions and audiences. Plus, custom reports can also help marketers discover new insights and opportunities that they might otherwise miss.
Step-by-Step Guide: Creating a Custom Report in Datorama
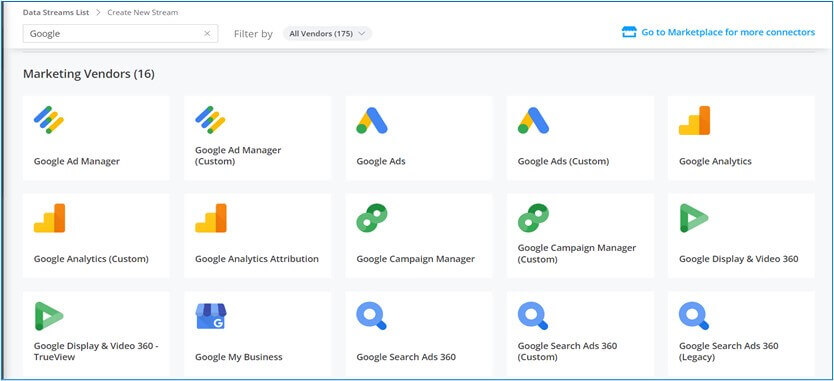
Step 1: Choose Your Data Source
The first step in creating a custom report is choosing your data source. You can select any data that is available in your Datorama account. This can include data from multiple sources, such as Google Analytics, Salesforce, social media platforms, email marketing services, and more. Once you’ve chosen your data source, you can move on to the next step.
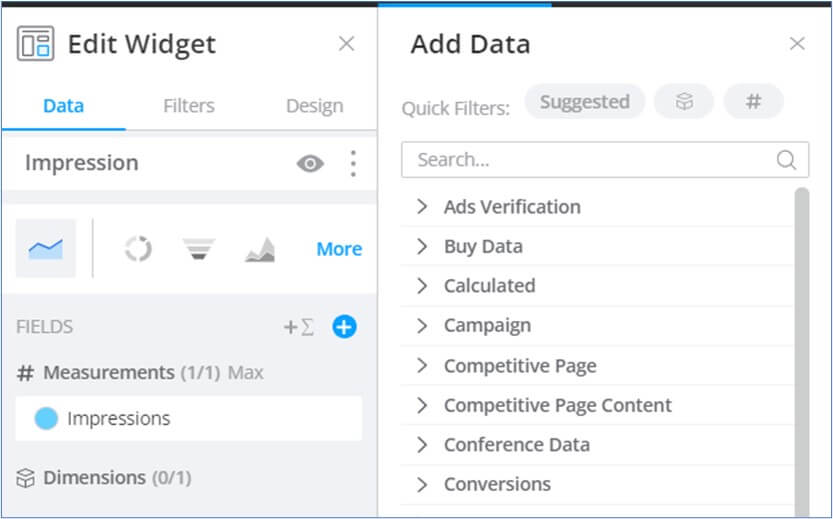
Step 2: Select Your KPIs
The next step is selecting your Key Performance Indicators or KPIs. These are metrics that help you measure the performance of your marketing effort. Some of the examples of KPIs can be things like Clicks, CPM, CTR, ROAS, and engagement on social media. Datorama provides a variety of pre-built KPIs that you can choose from. If not, you can create your own custom KPIs.
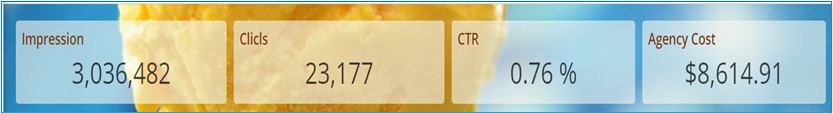
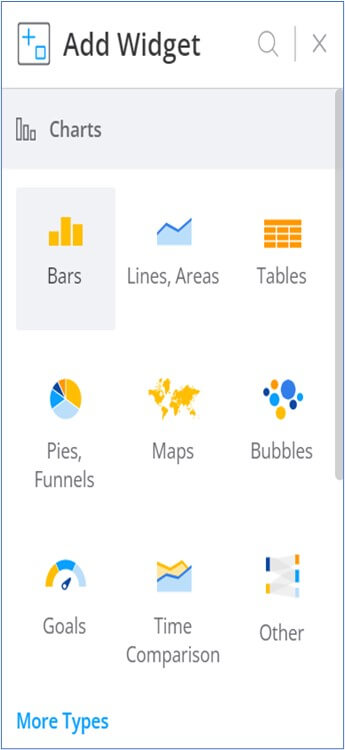
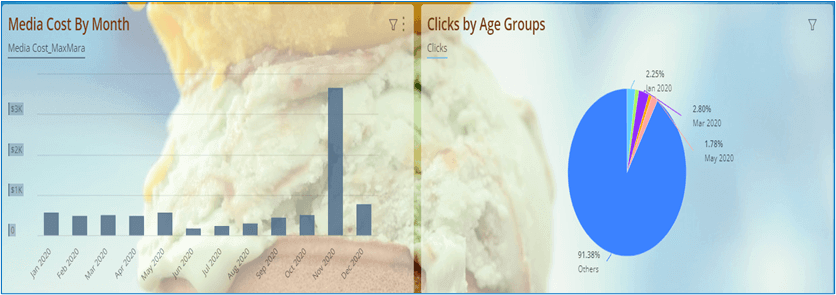
Step 3: Choose Your Visualizations
Once you’ve selected your KPIs, you can choose how to visualize your data. Datorama provides a range of visualization options such as tables, charts, and graphs. Plus, it also gives you the option of customizing the layout and design of your report to suit your specific needs.
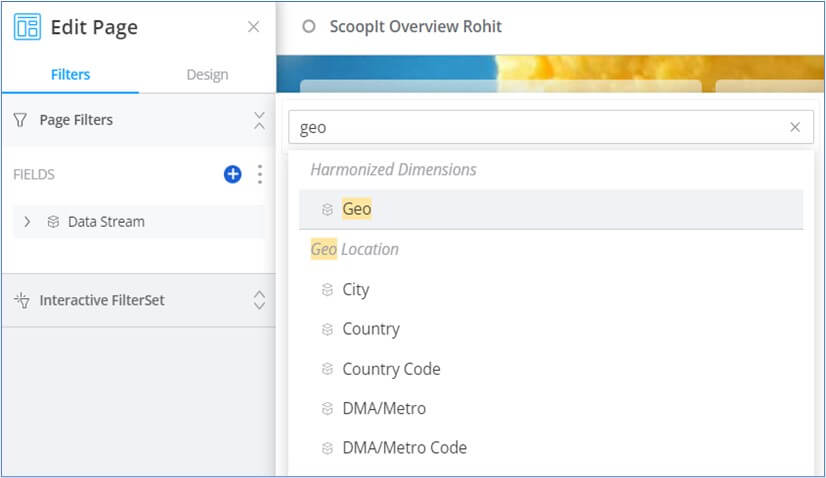
Step 4: Add Filters
Filters are a useful tool for segmenting your data based on specific criteria. For example, you might want to filter your data by geography, device type, or time period. Datorama provides a variety of filters that you can use to gain more granularity in your analysis.
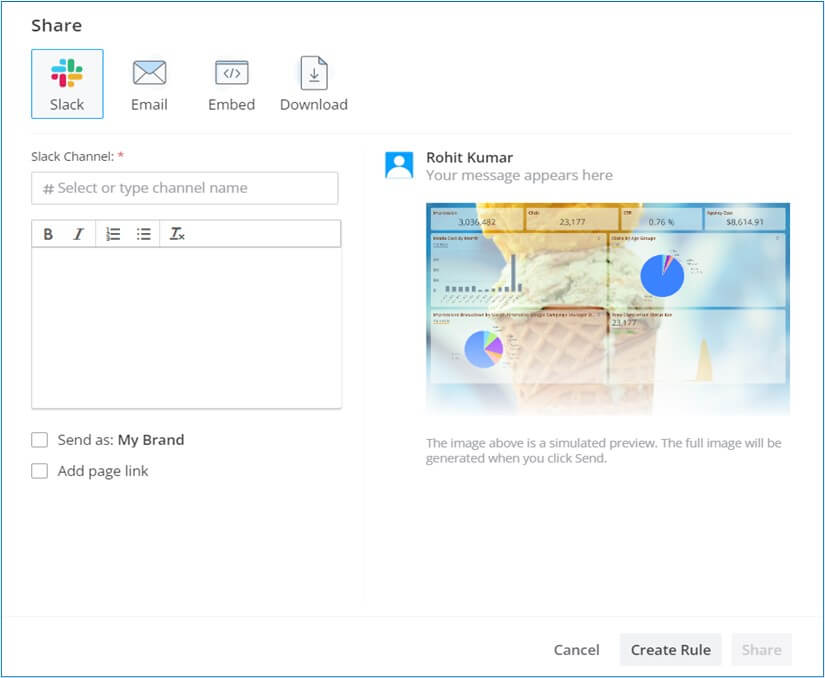
Step 5: Save and Share Your Report
After you’ve created your custom report, you can save it for future use. You can also share your report with others in your organization, providing them with the insights they need to make data-driven decisions.
Dashboard
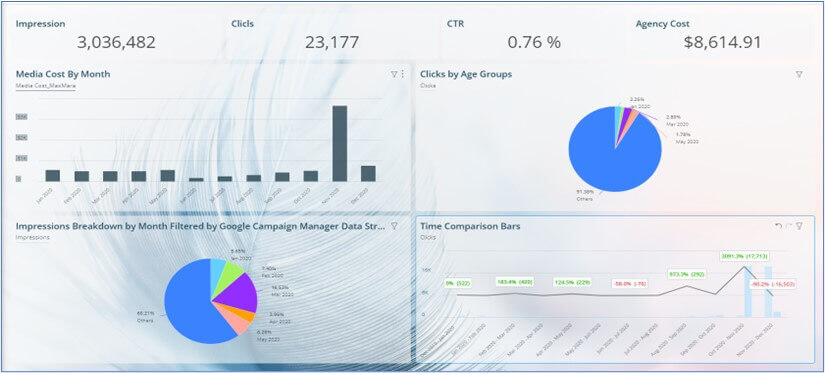
Leveraging Data Analysis for Informed Marketing Decisions
Datorama: Empowering Marketers with Data Insights
In conclusion, creating a custom report in Datorama is a no-fuss, straightforward process. By choosing your data source, selecting your KPIs, choosing your visualizations, adding filters, and saving and sharing your report, you can get the insights you need to make informed marketing decisions. Whether you are looking to measure CPM, CTR, social media engagement, or email open rates, Datorama has the tools you need to get the job done.
