Media Coverage
 Press Release
Dynamic Date Calculations Using Sets in Tableau: Optimizing Time-Based Analysis
Enhancing Time-Based Analysis with Dynamic Date Sets in Tableau
Leveraging Sets for Dynamic Date Filtering: Techniques and Strategies
The most common requirement in my experience when building out a business dashboard, is to provide the ability to be able to slice and dice the KPIs over multiple periods of time to get a sense if the metric is heading in the right direction or not. To do this, you would generally compute your metric for the current date period and then compare it against the prior date period value to showcase the increase or decrease. Adding another layer of complexity to this requirement would be to allow the end user to select the metric computation date period via a dropdown menu, and as a dashboard designer, the onus is on you to make this work in the most efficient way possible. Some of the examples of date periods could be year to date, rolling 12 months, same month prior year, prior month etc. For example, if the user selects year to date and then selects the month of April 2021, the KPIs should be computed for Jan 2021 to April 2021 as the current period, to be compared to Jan 2020 to April 2020 as the prior period.
Understanding Dynamic Date Calculations: Techniques for Dynamic Time Analysis in Tableau
Creating Dynamic Date Sets: Strategies for Flexibly Filtering Data Based on Date Ranges
Visualizing Trends Over Time: Enhancing Time Series Analysis with Dynamic Date Filters
Optimizing Time-Based Dashboards: Best Practices for Dynamic Date Filtering in Tableau
Before I dive deeper into the technical aspect of how to perform date calculations like YTD, Rolling 12 Months, Prior Month (PM) and Same Month Prior Year (SMPY), I would like to stress the importance of two things on a Tableau dashboard:
1. Actionable Insights
2. Dashboard Performance
The actionable insights make it clear what actions need to be taken and how organizations should make data informed decisions to course correct if need be, whereas the dashboard performance determines how smoothly can the former be done. Coincidentally, date comparisons using sets can aid both to a significant extent even with a complex and heavy dataset.
Leveraging Sets for Dynamic Filtering: Enhancing Time-Based Analysis with Tableau Sets
Visualizing Trends Over Time: Techniques for Dynamic Time Series Analysis in Tableau
Creating Dynamic Date Sets: Strategies for Flexibly Filtering Time-Based Data in Tableau
Best Practices for Dynamic Date Calculations: Optimizing Time-Based Analysis in Tableau
The primary objective of this blog is to provide a detailed walkthrough on how to effectively incorporate date metric calculations (YTD, PM, SMPY etc.) using Sets to provide actionable insight for the respective metric and at the same time build on an important Tableau optimization principle of “Strings and dates are slow, numbers and Booleans are fast.“
Sets are user created fields based on dimensions which at the highest level creates subsets of your data based on some conditional logic. If you are not familiar with Tableau Sets, I would recommend going through the Sets resource page on Tableau’s website before proceeding further.
I would be using the Tableau Sample – Superstore dataset to demo this technique. Please feel free to download the workbook to follow along. This blog will help guide you on how to build out sets and calculations to create dynamic date calculations in order to optimize your workbook performance and enable you to create actionable insights. Without further ado, let us jump right in.
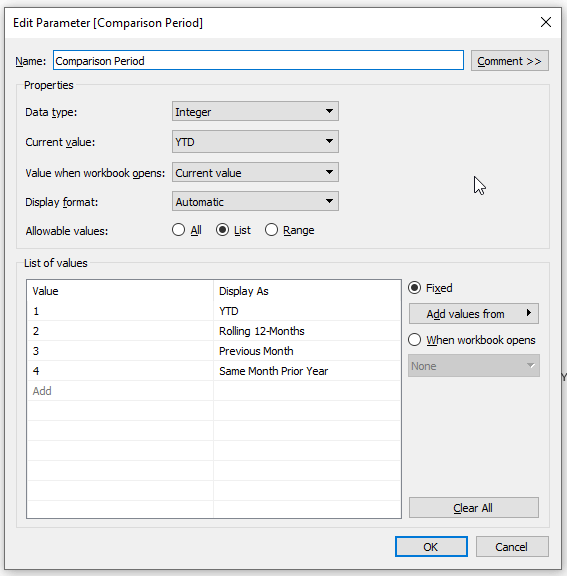
Step 1: Create parameter “Comparison Period“
The name could be anything, but the configuration should look something like below. This is the place where you would list all the comparison options that you would like the end user to have. For this writing, I will be dealing with the below four, however, this is not an exhaustive list but should be good enough to drive the point.
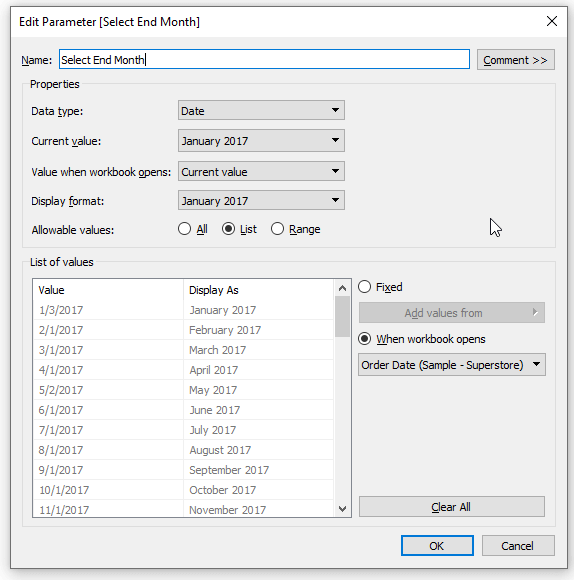
Step 2: Create parameter “Select End Month“
This parameter will act as the reference month giving the user the freedom to compute metric for the month of their choice. For e.g. selecting April 2021 here would compute all comparison with reference to this month. YTD will sum sales value for the months from Jan 2021 to April 2021, Rolling 12-Months will sum sales from May 2020 to April 2021, so on and so forth.
You can make this a dynamic parameter by pointing it to the date field in your data source. In this case, I will be using the field Order Date. I then change the Display format to Month Year. You may see a red warning alert due to the repetition of values, but you can click ok and close it.
If in your design, you would like the current month to be the reference point always, then you can skip this step and replace this parameter with a calculated field that gets you the current month. DATETRUNC(‘month’,TODAY()) is one way to do it.
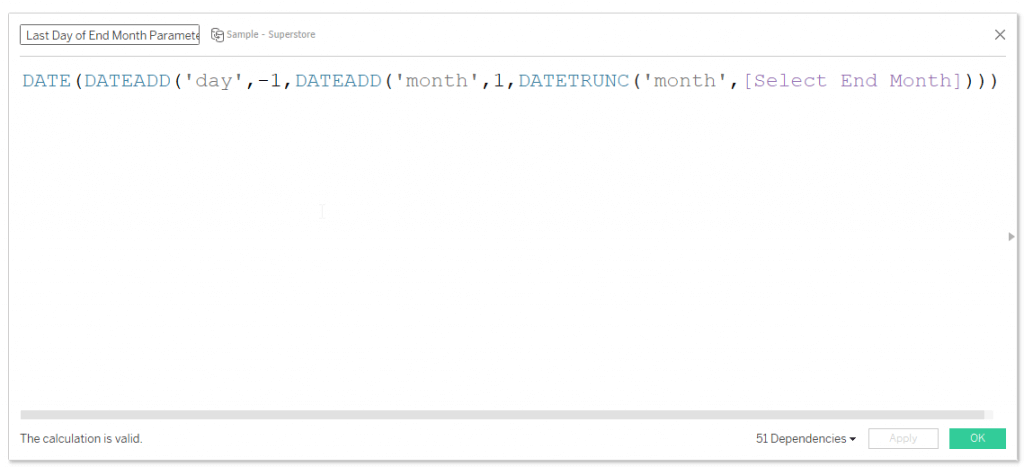
Step 3: Create calculated field to compute the last day of “Select End Month” parameter
This will be required for the calculations in following step, and it establishes the upper end date limit that would need to be considered for calculating YTD, SMPY, PM etc.
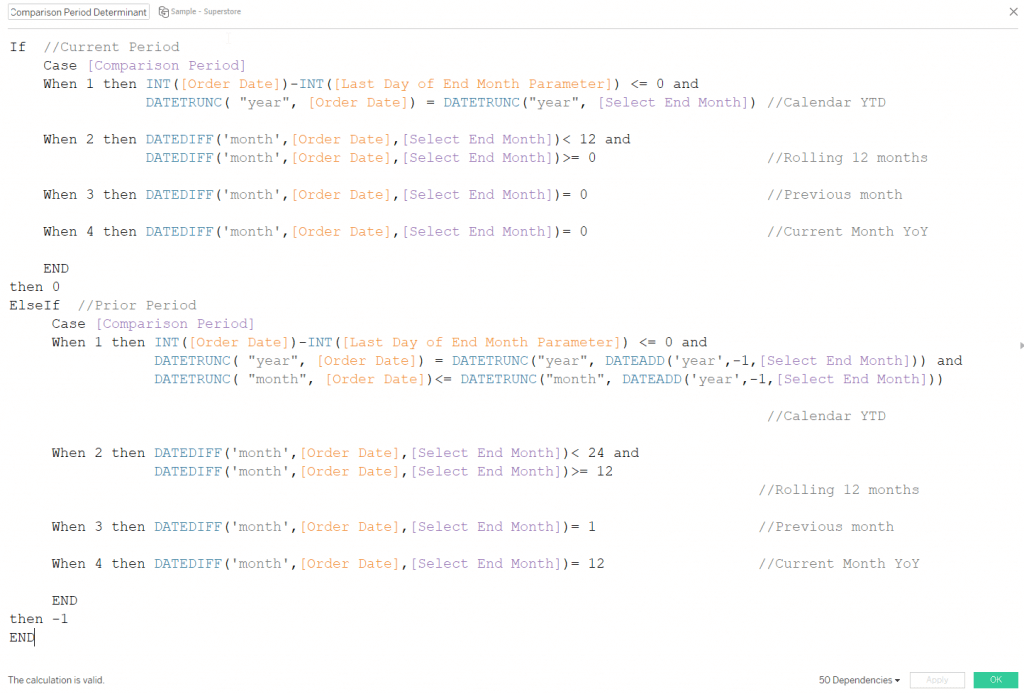
Step 4: Create a calculated field “Comparison Period Determinant”
This is the place where the date logic for each of the period gets computed. At a very high level, this logic will segregate the underlying dataset into 3 categories based on the date values present in the [Order Date] field:
Category 1: All rows of data having 0 assigned against them for this field represent the “Current” period. These are the dates that satisfied the “If” part of the below statement. For e.g. if the [Select End Month] parameter has April 2021 selected and [Comparison Period] parameter has Previous Month option selected, then within the “If” statement, the Case statement will bring the control to “When 3” and based on the logic all rows with [Order Date] of April 2021 will return true and hence would be assigned a value of 0 against them per the “then” statement. On the same lines, all rows with [Order Date] of Jan 2021 to April 2021 will be assigned value of 0 if you have YTD selected for [Comparison Period] parameter and so on and so forth for the other parameter options.
Category 2: All rows of data having -1 assigned against them for this field represent the “Prior” period. These are the dates that satisfied the “ElseIf” part of the conditional statement. For e.g. if the [Select End Month] parameter has April 2021 selected and [Comparison Period] parameter has Previous Month option selected, then within the “ElseIf” statement, the Case statement will bring the control to “When 3” and based on the logic all rows with [Order Date] of March 2021 will return true and hence would be assigned a value of -1 against them per the “then” statement. On the same lines, all rows with [Order Date] of Jan 2020 to April 2020 will be assigned value of -1 if you have YTD selected for [Comparison Period] parameter and so on and so forth for the other parameter options.
Category 3: All other rows of data would have NULL value assigned to them as the logic in the calculated field does not handle them. This is perfectly alright and very much what we want.
Tip: The best way to check if your logic is working is to build a simple sheet like below and see what values are being assigned against each of the [Order Date] values by changing the two parameter values.
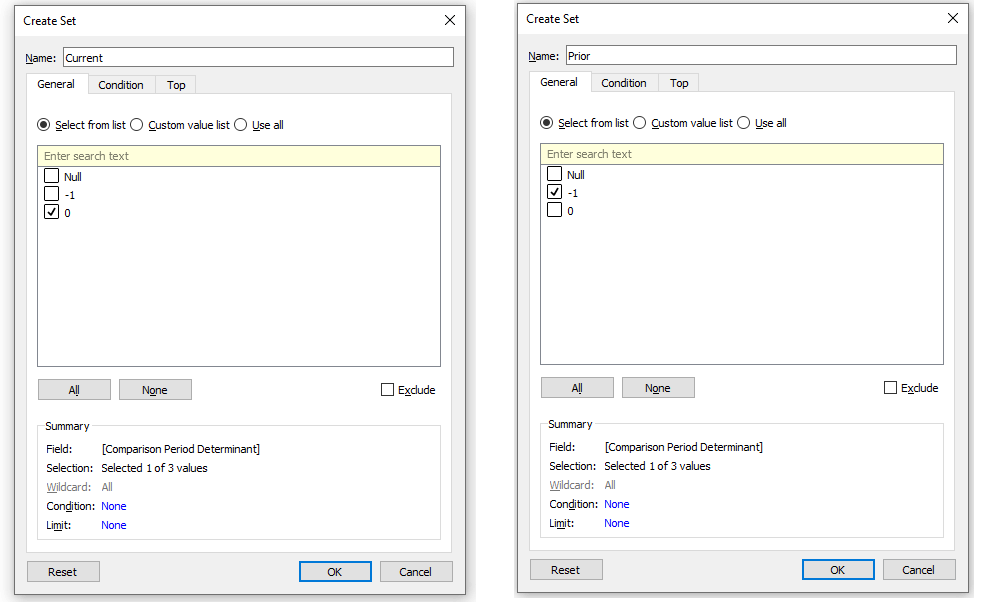
Step 5: Create Current and Prior Sets
To create sets of the calculated field we created in the above step, convert the “Comparison Period Determinant” field to dimension. Now create set “Current” of this field and select only 0 from the list. Then create set “Prior” by selecting just -1 from the list.
The beauty of these sets is that they are highly optimized and dynamically segregate the data for current and prior period based on the selections in the two parameters even without being dragged on to the sheet’s filter pane. This is a very critical point to note, since it does not filter the data, you have both Current and Prior period data now available in the same sheet to be compared against each other, exactly what we want to do. For e.g., we can now compare sales of April 2021 with March 2021 and know if there was an increase or decrease.
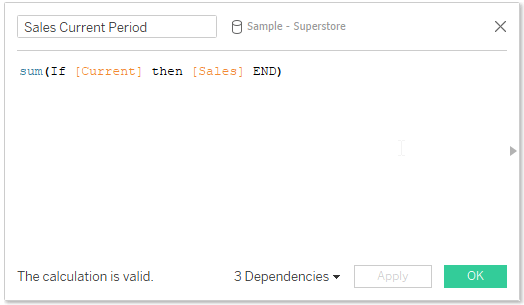
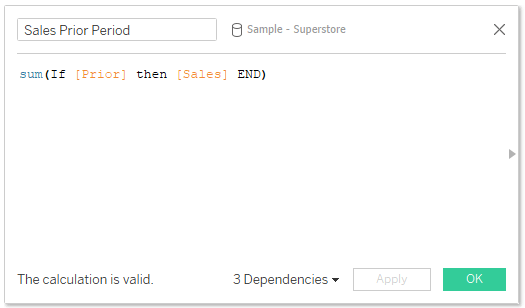
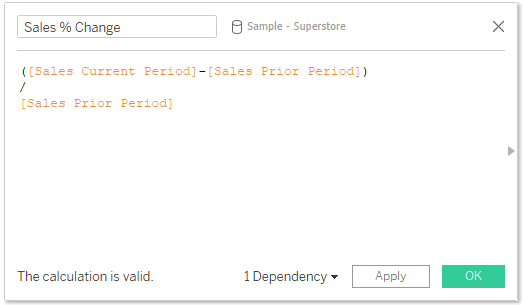
Step 6: Build respective KPI calculated fields using the above sets
For every KPI, we build Current Period, Prior Period and % Change calculated fields. The screenshots below will be for one of the metric Sales, however, please feel free to download the workbook for checking out the others.
After building out each percent change calculations for each of our KPIs, we can now easily see which metrics increased/decreased in value over our chosen comparison period by using some custom formatting with up/down arrow indicators and coloring for negative/positive values. Now, our parameters will seamlessly change the percent change calculations allowing for quicker actionable insights and because of the way we leverage sets in our calculations, our dashboard will be performant as well.
Below is a screenshot of the redesigned dashboard.
Please note, that like all other things in Tableau, you can achieve the same result in other ways by not using sets and by just the calculated fields route. However, it may or may not be as efficient as sets depending on how you set it up and your underlying dataset. But this would be an interesting topic to be explored as a subject for another blog.
In my experience, sets technique is super performant even with a very dense dataset but, I will leave it for your exploration. Hope you were able to get some value out of this technique.