


 Media Coverage
 Press Release
Marketing data is everywhere. It comes from various sources, such as social media, web analytics, email campaigns, CRM systems, and more. It can be overwhelming to manage and make sense of all this data, especially when you have multiple tools and platforms to deal with.
That’s why you need Datorama, a marketing intelligence platform that enables you to connect your entire MarTech stack and gain insights from your data.
Simplify Marketing Data Management with Datorama
Managing the Deluge of Marketing Data
Empowering Marketers with Data Connectivity
Unleashing Insights through Data Analysis
Visualizing Success: The Power of Datorama
Datorama’s Three Pillars: Connect, Analyze, and Visualize
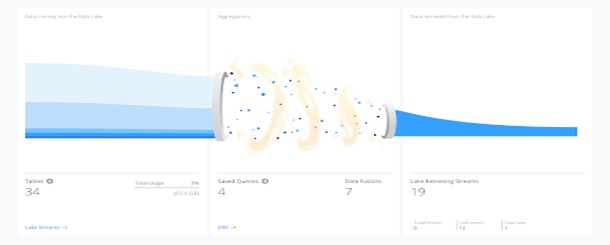
Connect and Mix: Harnessing Data Integration
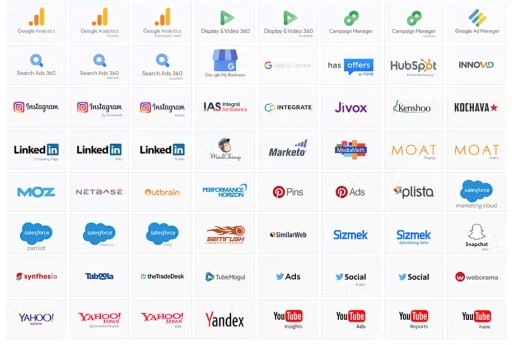
Connect and Mix is where Datorama excels. This feature offers a number of connectors designed to enrich marketing analytics by integrating data from various marketing sources, such as Google Adwords, Facebook, Instagram, TikTok, and more. Datorama also gives you the option to consume data by ingesting flat files like .xls, .csv, .json or even use technical vendors such as MySQL, MongoDB, Amazon, etc.
Data Integration Made Effortless
Standardize and Enrich Your Marketing Data
Once you have your data in Datorama, you can use the Harmonization Center to standardize and enrich it. You can use tools such as:
- Classification Files: These help you create consistent naming conventions for your data fields.
- Naming Patterns: These help you split your data fields into subfields based on separators.
- Calculated Measurements and Dimensions: These help you create new metrics and attributes based on your existing data.
Analyze and Act: Smart Insights and Automation
This feature allows users to create pivot tables, set goals and thresholds, and automate report distribution. You can also leverage Salesforce’s AI to get smart insights and recommendations.
From Data to Actionable Insights
Setting Goals and Achieving Marketing Excellence
The Analyze and Act feature has two main components:
- Pivot Tables (similar to Datorama reports for Marketing Cloud)
- Goals which help you set minimum-maximum range goals for any predefined marketing metric (useful for tracking revenue and impressions)
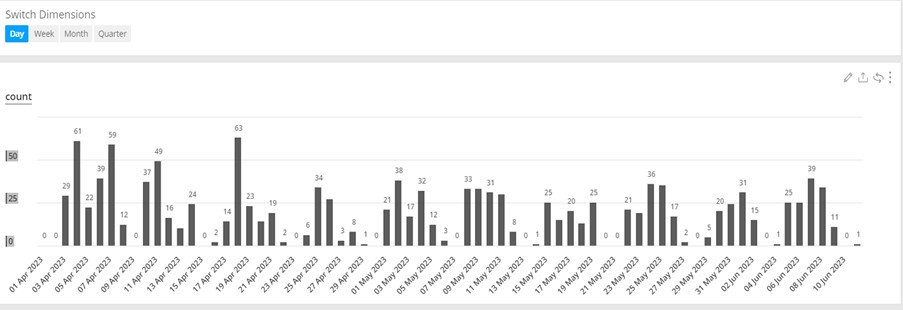
Visualize: Custom Dashboards for Informed Decisions
The marketer’s playground! This feature allows you to create custom dashboards using a drag-and-drop interface and a variety of visualization options. With the right analytical prowess, this offers unlimited possibilities for custom visualizations that can be shared with your stakeholders.
Crafting Custom Visualizations with Datorama
Organize and Share with Datorama Workspaces
Like Marketing Cloud’s Business Units, Datorama also offers Workspaces that can be used to organize your dashboards based on your organizational hierarchy and access requirements.
Conclusion: Elevate Your Marketing Efforts with Datorama
To sum up, Datorama makes it easy to ingest data from various sources using API connectors, harmonize and classify the data, create pivot tables for quality assurance, and visualize the data on dashboards with different charts and graphs. It allows you to quickly and easily create reports that show you the key performance indicators (KPIs) of your marketing campaigns. You can also filter the data by different dimensions and share your reports with others. Datorama helps you get the insights you need to make smart marketing decisions, optimize your campaigns, and improve your ROI.
