


 Media Coverage
 Press Release
Pixel Perfect Reporting for Tableau
The #1 Reporting Solution
Generate print-ready, compliance-grade reports directly from Tableau. Highly formatted, paginated PDFs, Excel crosstabs, PowerPoint decks, Word docs, and more with automation, scheduled bursting, and brand consistency built in.
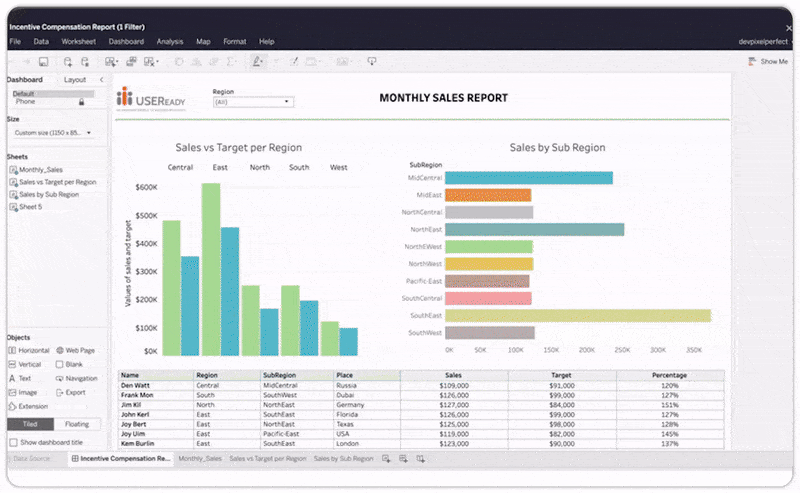
Turn Tableau Dashboards into Compliance-Ready Reports
Enterprise-Ready Reporting You Can Trust

How It Works?
Easily create reports in 3 simple steps
Step 1: Enable the Tableau dashboard with the Pixel Perfect extension
Step 2: Explore the dashboard like you would conventionally do, to seek the necessary information or insights
Step 3: Click Pixel Perfect Report Icon (export button) to generate canned reports in your preferred output format
Why Enterprises Choose Pixel Perfect?

Automates reporting workflows, reducing errors and manual effort

Delivers compliance-ready, brand-consistent reports

Retires legacy BI platforms while preserving Tableau analytics.

Scales to thousands of reports, dashboards, and recipients.
Flexible Deployment,
Transparent Licensing

Cloud, on-premises,
or hybrid deployment

Scalable licensing options for teams
and enterprise-wide access

Enterprise support, SLAs, and roadmap for
future AI-enabled reporting features
Partner Recommendations

Resources
Success Stories

Watch Videos

Blogs
Frequently Asked Questions
What is Pixel Perfect for Tableau? 
How is Pixel Perfect different from Tableau’s native export?
Tableau’s native export is limited to snapshots or simple downloads and often fails to maintain pagination, headers/footers, or brand consistency. Pixel Perfect goes beyond by:
- Preserving dashboard layouts and formatting
- Supporting multi-page, paginated PDFs and Excel crosstabs
- Automating report bursting and distribution
Which formats can Pixel Perfect export to?
Pixel Perfect supports a wide array of formats, including:
- PDFs with headers, footers, watermarks, and section breaks
- Editable PowerPoint decks for client or board presentations
- Excel crosstabs for pivot and analysis
- Word documents for documentation or narrative reporting
- CSV files for further analytics or system integration
Can I schedule or burst reports automatically?
How does Pixel Perfect maintain brand consistency?
Does Pixel Perfect work with Tableau Cloud and Tableau Server?
How does Pixel Perfect support compliance and audit reporting?
Who is Pixel Perfect designed for?
Pixel Perfect is purpose-built for:
- BI Leaders and Data Analysts managing enterprise reporting
- Finance and FP&A teams generating board-ready outputs
- Compliance and Risk officers in regulated industries
- Enterprises seeking to modernize reporting while retiring legacy BI platforms
Can Pixel Perfect handle large datasets?
Is Pixel Perfect secure?
How easy is it to install and configure Pixel Perfect?
Can Pixel Perfect replace legacy BI tools completely?
How does Pixel Perfect compare to competing reporting solutions?
Pixel Perfect stands out with:
- True Tableau integration (not a separate reporting stack)
- Enterprise-grade automation for report generation and distribution
- Template-driven compliance reporting
- Proven success across finance, healthcare, government, and manufacturing
Can I generate reports on-demand from dashboards?
How does Pixel Perfect handle recurring reports?
Is there a Pixel Perfect demo available?
What industries benefit most from Pixel Perfect?
Pixel Perfect delivers proven value across highly regulated industries, including:
- Financial Services – for audit and board reporting
- Insurance – for regulatory filings
- Healthcare & Life Sciences – for compliance reporting
- Government/Public Sector – for secure, audit-ready reporting
- Manufacturing – for operational dashboards and reporting
How does Pixel Perfect handle versioning and updates?
What is the licensing model for Pixel Perfect?
Why should my organization choose USEReady and Pixel Perfect?
Because USEReady is a Tableau #1 Global Partner and award-winning Tableau specialist, with extensive experience delivering enterprise reporting automation. Pixel Perfect is proven to:
- Save time and reduce errors
- Ensure compliance and audit readiness
- Replace legacy BI platforms
- Automate report bursting and multi-format exports
You May Also Be Interested In
Migrating from
Legacy BI?
Use MigratorIQ to move from platforms like QlikView, Hyperion, Cognos, BusinessObjects and MicroStrategy to Tableau, faster and without risk.
Moving to
Tableau Cloud?
Fastest and most reliable Tableau Server to Tableau Cloud migration service delivering up to 80% faster deployments through automation, accelerators, and proven methodology.
Let’s Collaborate!
If you’re looking to transform decision making with AI, machine learning, and generative intelligence, contact our experts to explore how we can tailor solutions to your unique needs.