


 Media Coverage
 Press Release
The Requirement for Dynamic Field Formatting in Tableau
A very frequent requirement when building dashboards in Tableau is the facility to swap measures in a chart. This can be simply fulfilled using a calculation similar to the one below that returns a measure based on a parameter selection:
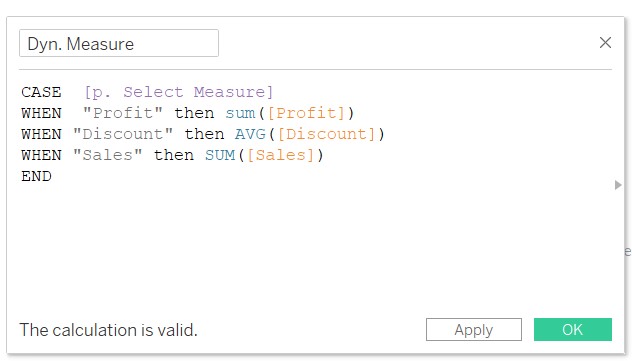
CASE [p. Select Measure]
WHEN "Profit" then SUM([Profit])
WHEN "Discount" then AVG([Discount])
WHEN "Sales" then SUM([Sales])
END
The challenge, however, is that each of the above measures will likely need different formatting, for example:
- Profit – displayed in thousands with a $ prefix and two decimal places
- Discount – displayed as a percentage with a % suffix and one decimal place
- Sales – displayed in thousands with a $ prefix and two decimal places
While formatting can be applied to this dynamic measure, it cannot be dynamically updated based on the parameter selection. Thus, Discount could end up formatted as a $ amount or your Profit formatted as a very large percentage as shown below:
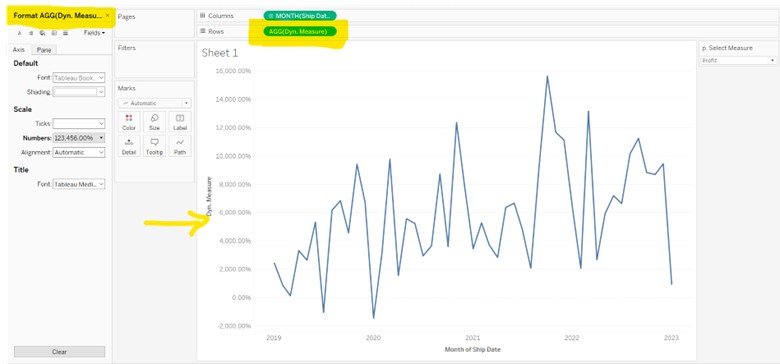
The Challenge of Dynamic Formatting for Different Measures
Method 1 – Take over formatting of the referenced measure
Default formatting can be used to any measure in the data model. When one (dynamic) measure is returning a different measure, the default formatting of the returned measure could be applied.
This isn’t as straightforward as it looks, however, as what’s reverted in these dynamic measure situations isn’t always a single measure. It can be the product of multiplying different measures together, for example, a measure to forecast profits increasing by a user defined percentage, such as:
WHEN “Profit + N%” THEN [Profit] * [% Increase]
Should the dynamic measure receive the formatting from the [Profit] field or from the [% Increase] field? One easy method here is to move that Profit * % increase calculation out to a separate calculated field and apply default formatting to that calculated field which could then be gotten within the dynamic measure field.
There’s also another way to do this. Stay tuned for Method 2…
