Media Coverage
 Press Release
With dashboard real estate at a premium, it is vital that we make every pixel count. This is where Dynamic Zone Visibility comes into play. By revealing and hiding dashboard elements based on selections, it is possible to create layered drill-down effects without compromising the layout or needing additional space. In this blog, we’ll explore how to leverage Dynamic Zone Visibility for multi-level drill-downs within a limited dashboard canvas.
So come along as we use parameters and actions to toggle visibility of sheets, building four levels of categorical data into a single compact view. By the end, you should have a fair idea of how to unlock this little-known Tableau feature and be able to get the most out of your dashboard dimensions.
In Dynamic Zone Visibility, the field or parameter must be boolean, single value and independent of the viz, meaning the field returns a constant value independent of the structure of the viz, such as a fixed level of detail (LOD) calculation.
In terms of use cases, Dynamic Zone Visibility has three viz. Swapping Dashboard sheets or elements (It allows us to provide an action from one sheet to another. We can create multiple levels of drill down utilizing the same space); Customizing dashboards based on user (it also allows us to show charts or customize the dashboards based on user login);and Display different combinations of charts based on the selections made.
Let’s take an example for a use case where we will drill down to four levels of data in the same space in dashboard.For this, we will use Sample Superstore data for the visualizations.
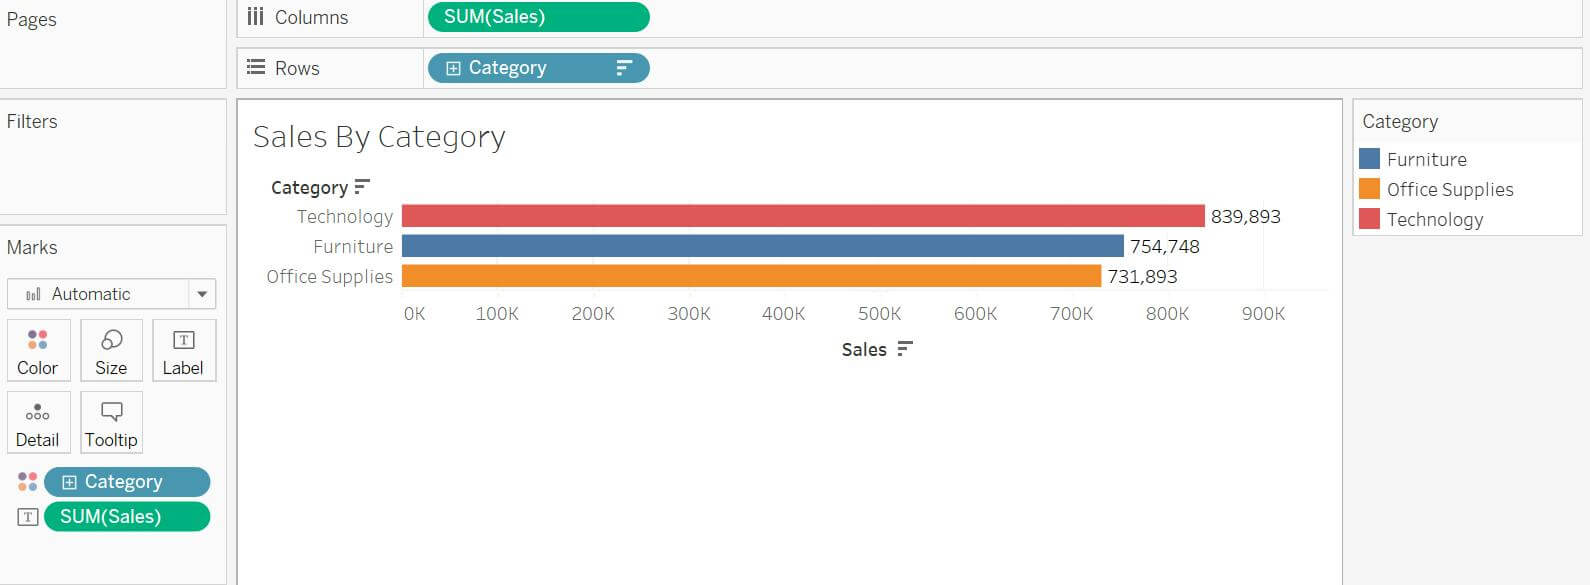
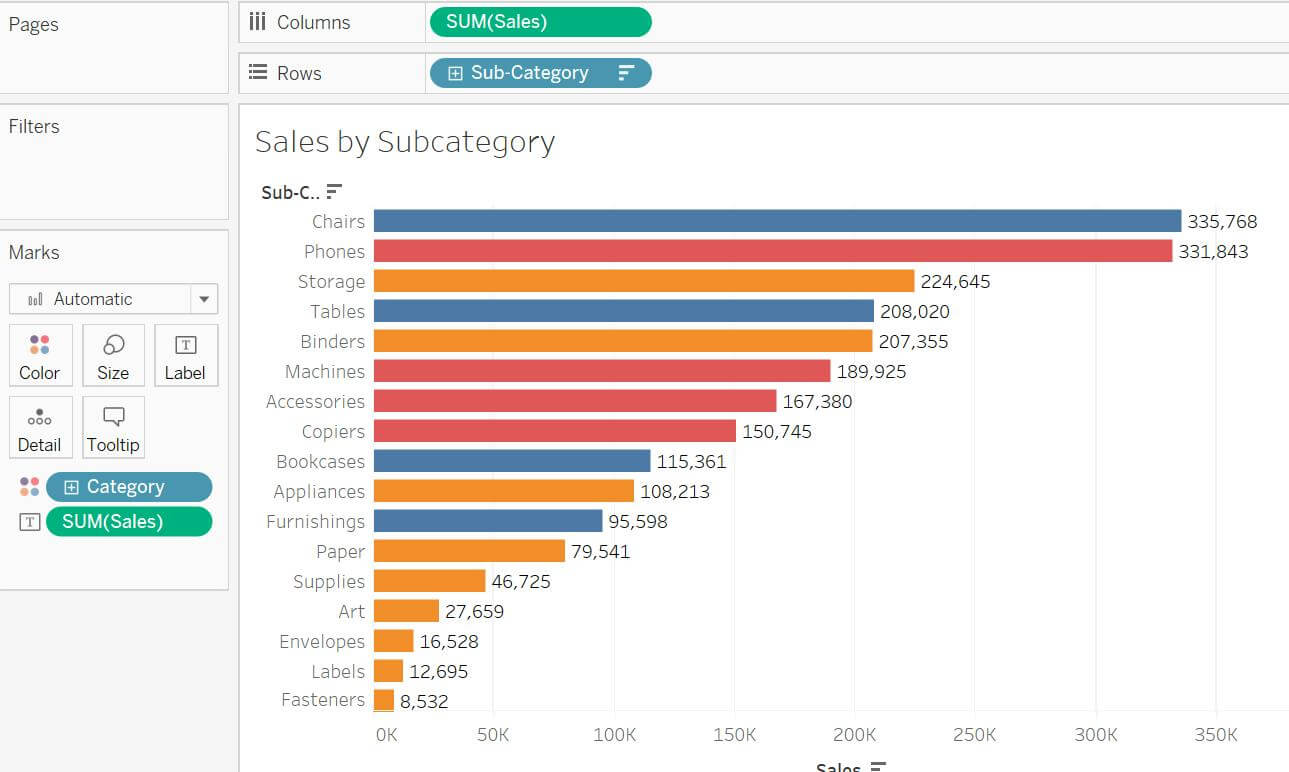
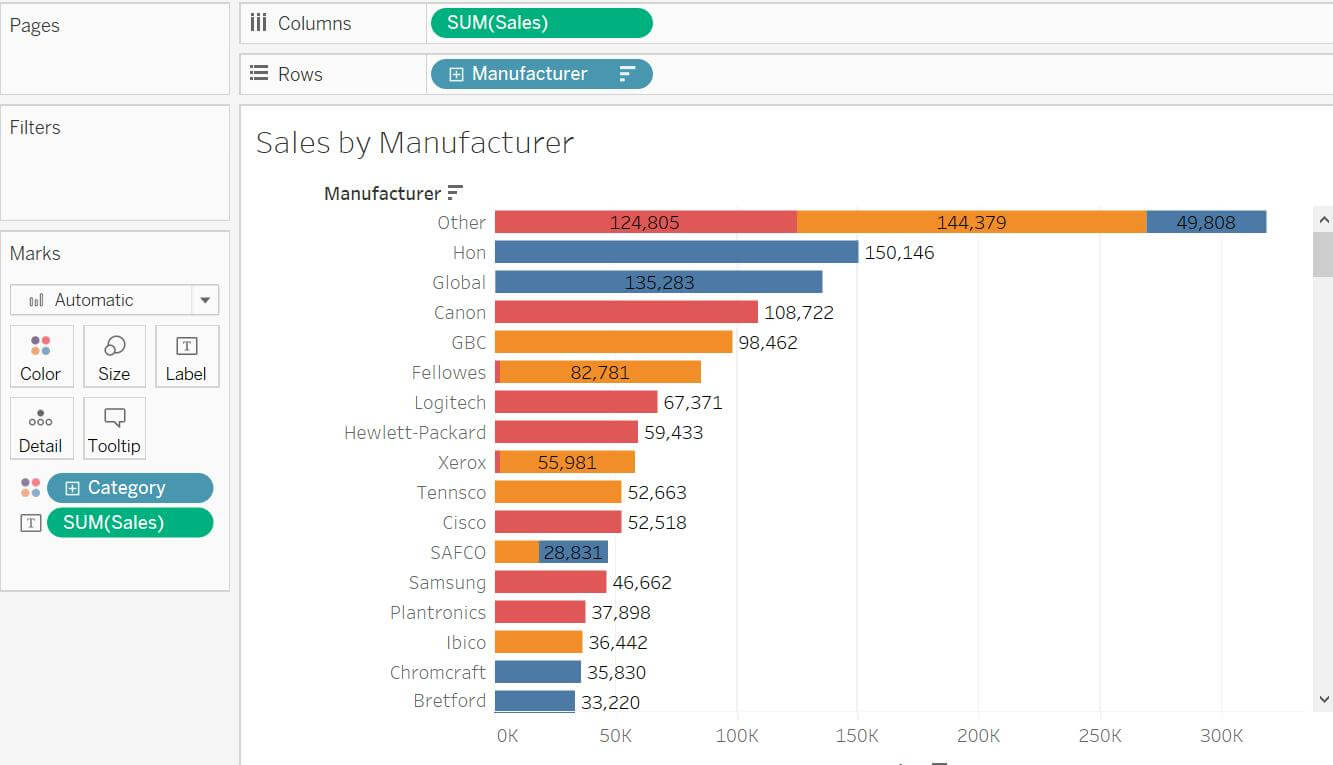
Step1 : Create 4 bar charts – Sales by Category, Sub-category, Manufacturer, and Product Name.
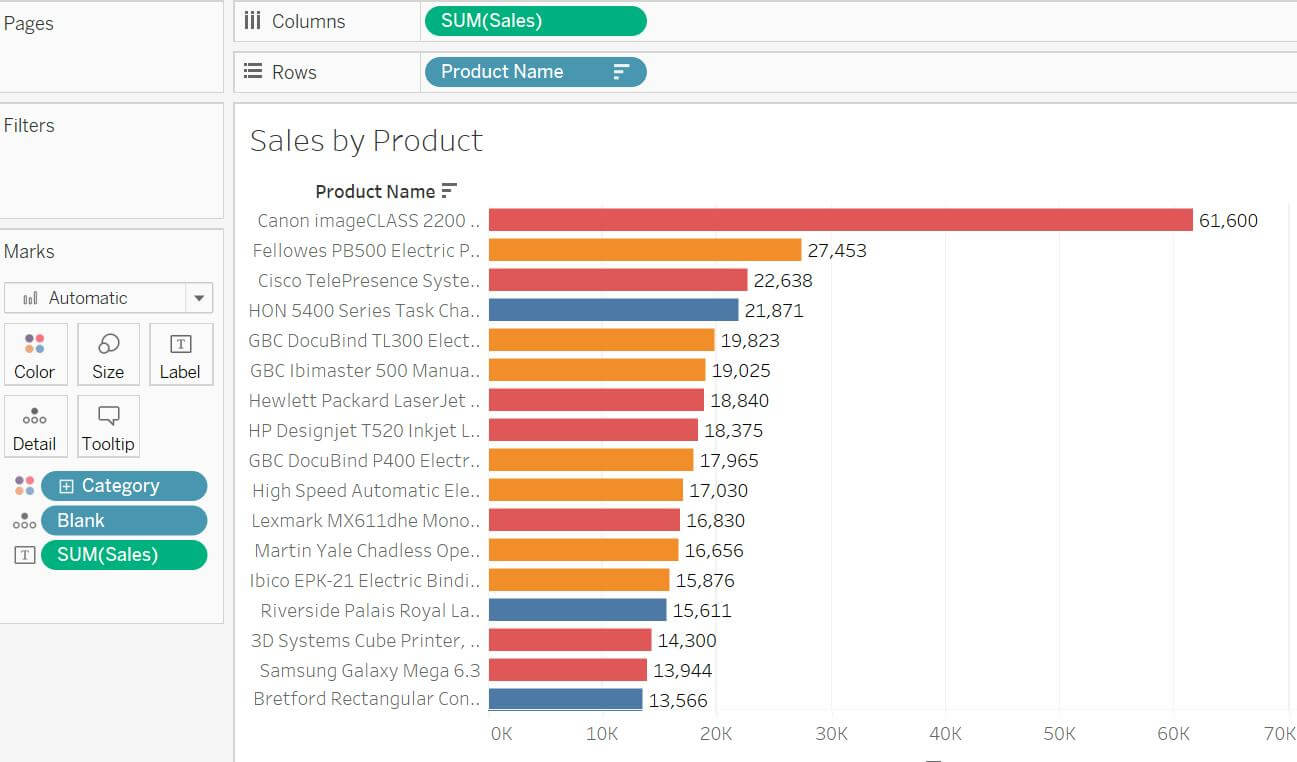
Step 2: Create a Blank calculated field and place it in Details tab of “Sales by Product” sheet.
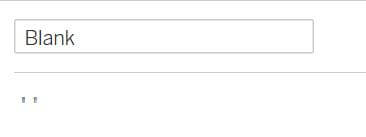
Step 3: Create a parameter for Blank Category.
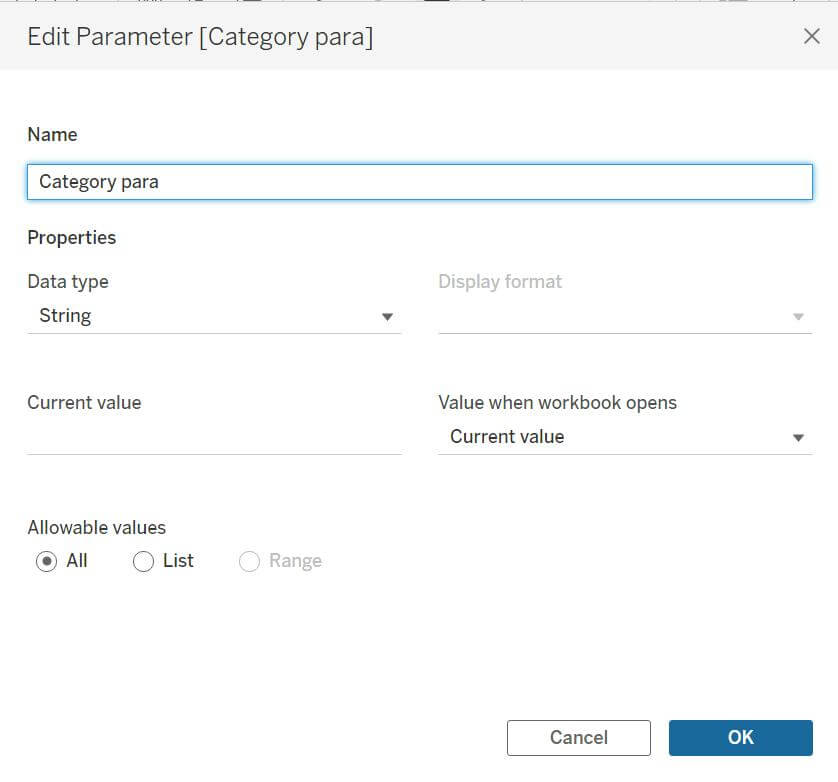
Step 4: Create same parameters for Sub- Category and Manufacturer also namely ‘Sub-Category para’ and ‘Manufacturer para’.
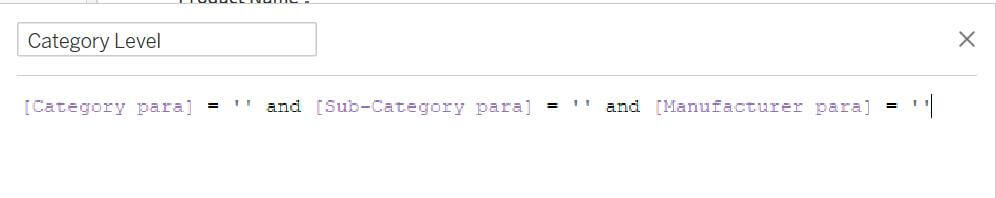
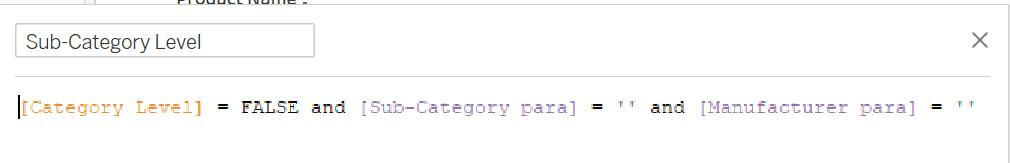
Step 5: Create the below shown calculations for creating a hierarchical / step wise visualization.
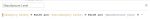
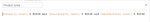
Step 6: Now we must ensure that when we click on one category, it filters those subcategories and so on.
For this, create the below calculations.
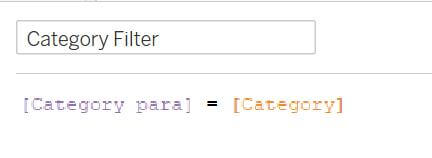
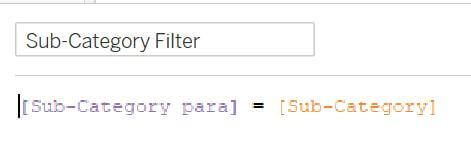
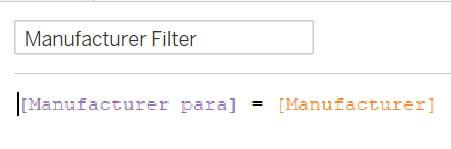
Step 7: Move the above three calculations (Category Filter, Sub-category Filter, Manufacturer Filter) in Filters shelf of Sub-category, Manufacturer and Product sheet respectively. Select True (if True is not available, select False and check Exclude).
Step 8: Create a new dashboard. Put a vertical container and put all these sheets inside the container.
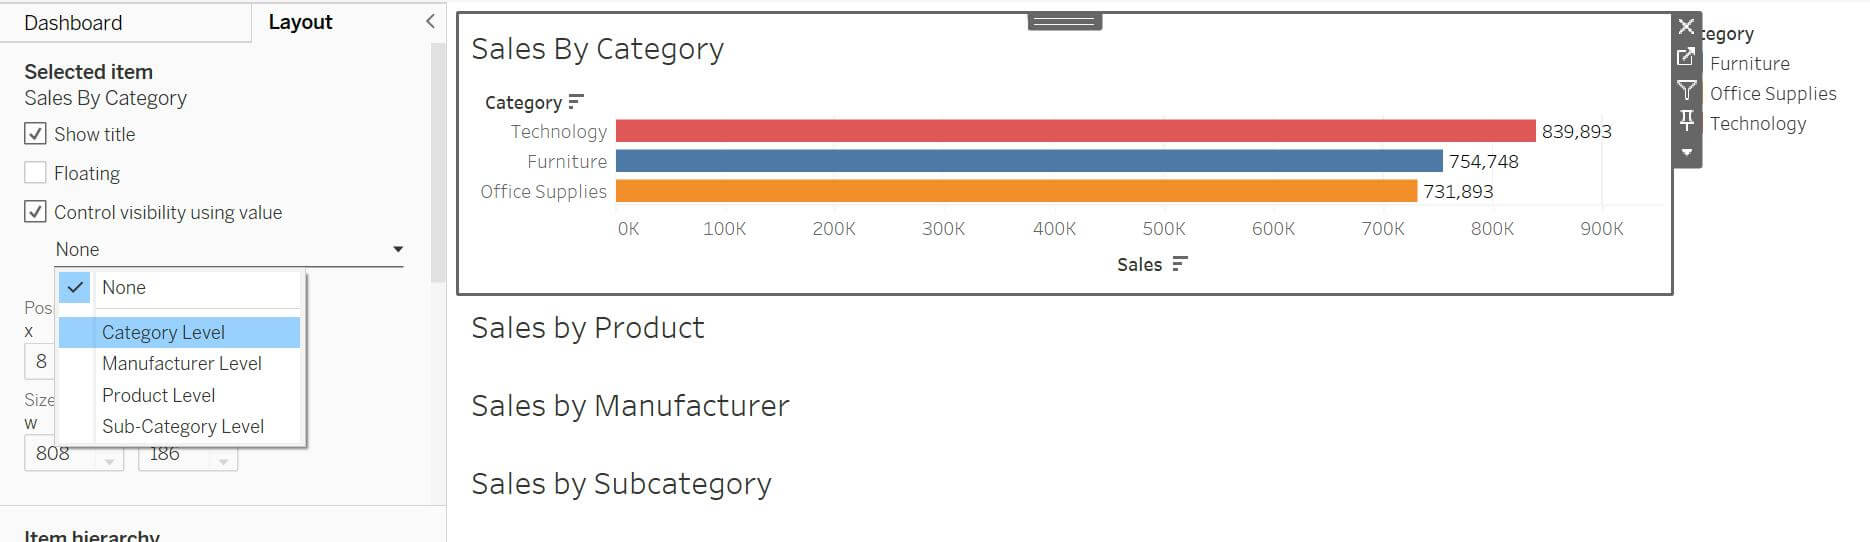
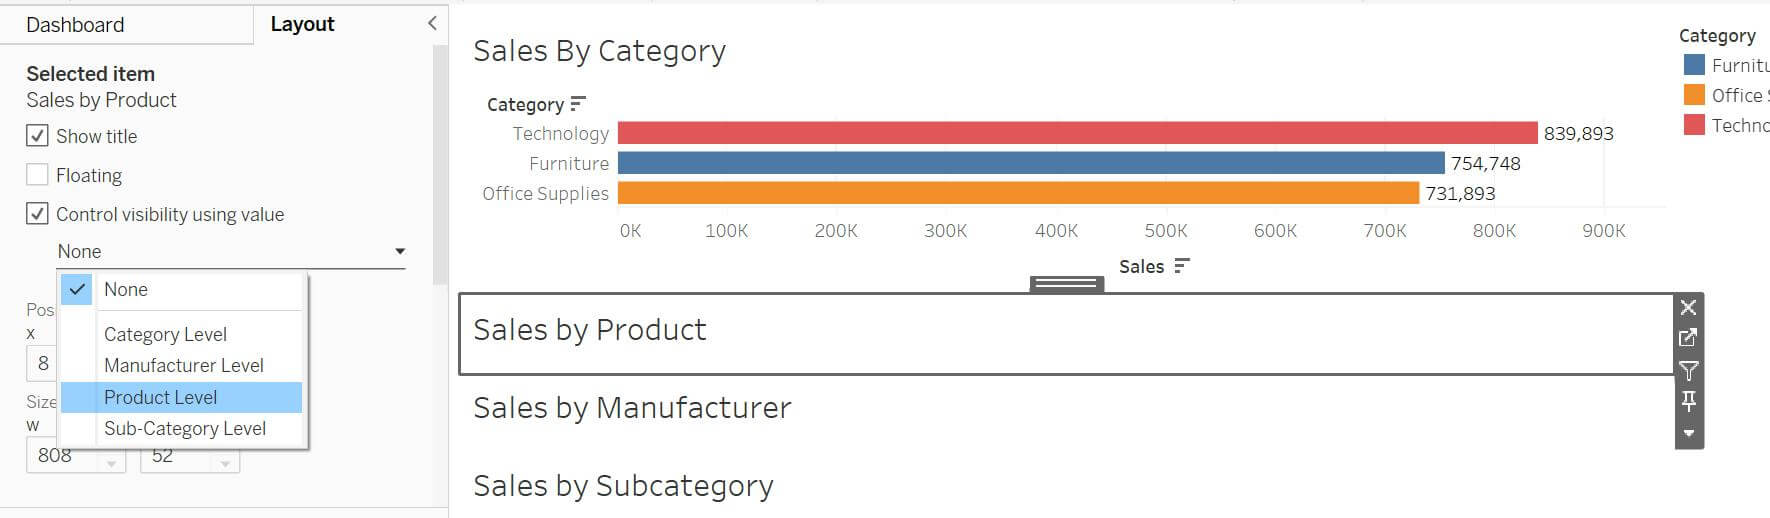
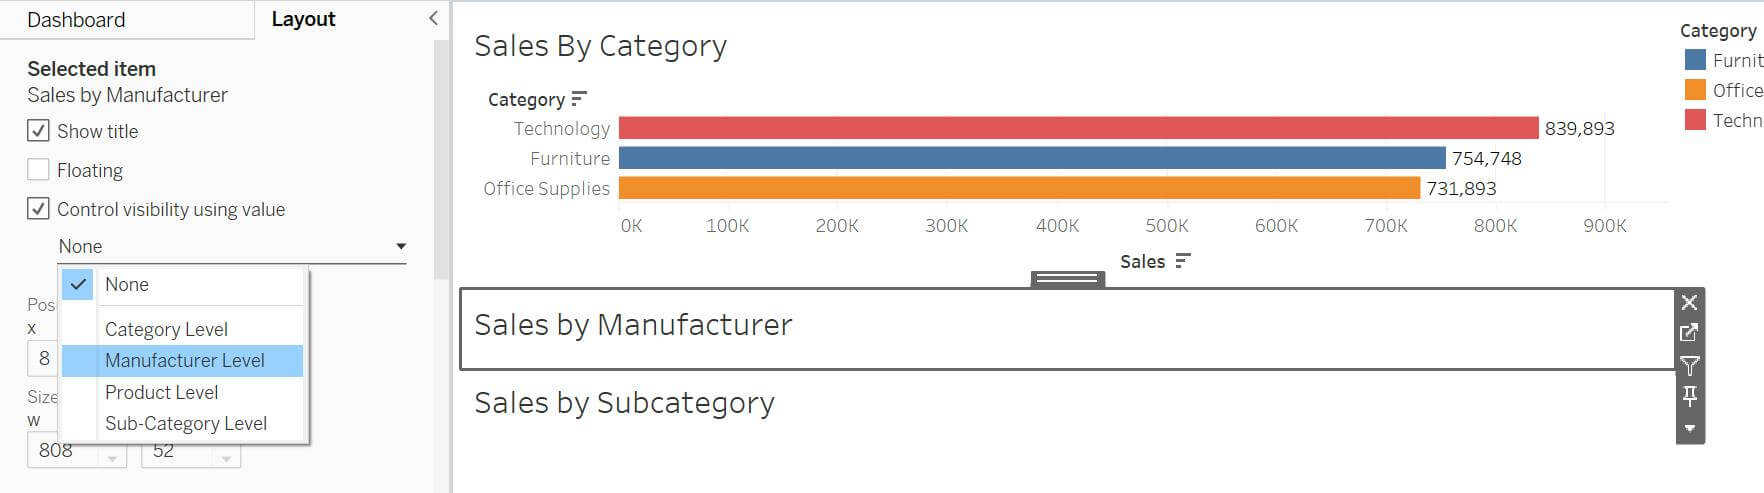
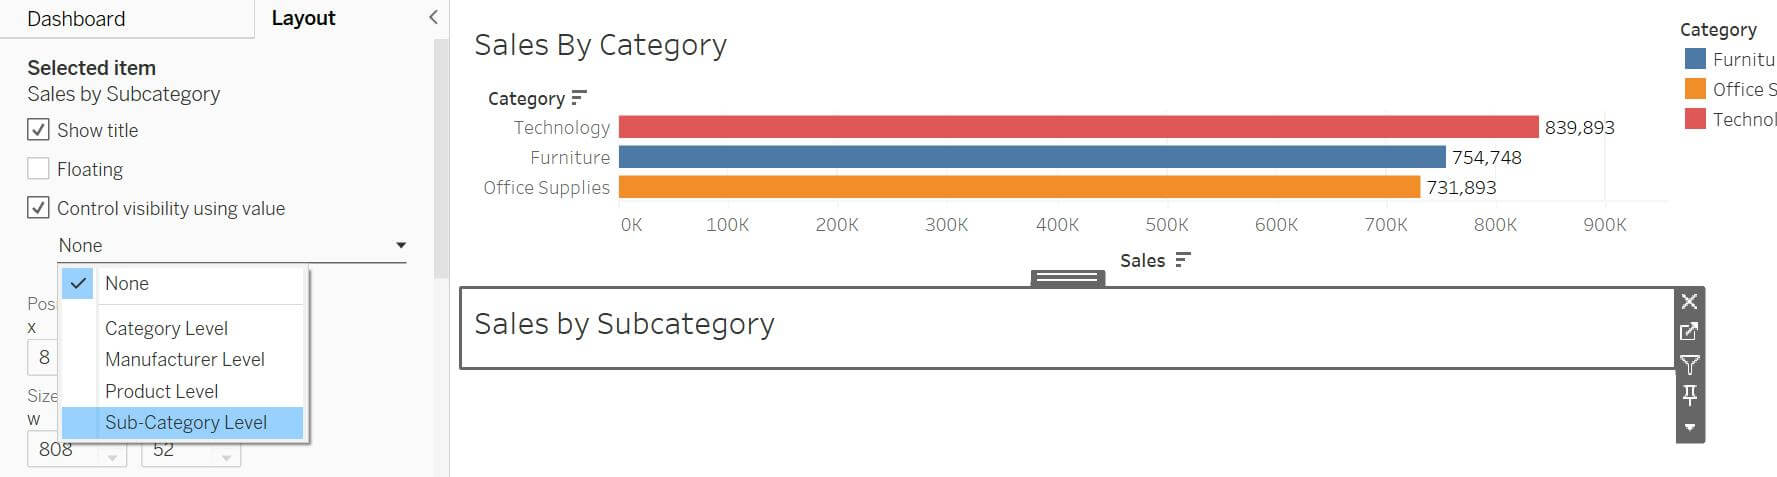
Step 9: To create dynamic visibility, follow the below steps.
- Select “Sales By Category Sheet”, go to layout tab, check “Control Visibility Using Value” and select Category Level.
- Follow same steps for all sheets one by one.
Step 10: Now it is time to create the actions from one sheet to another.
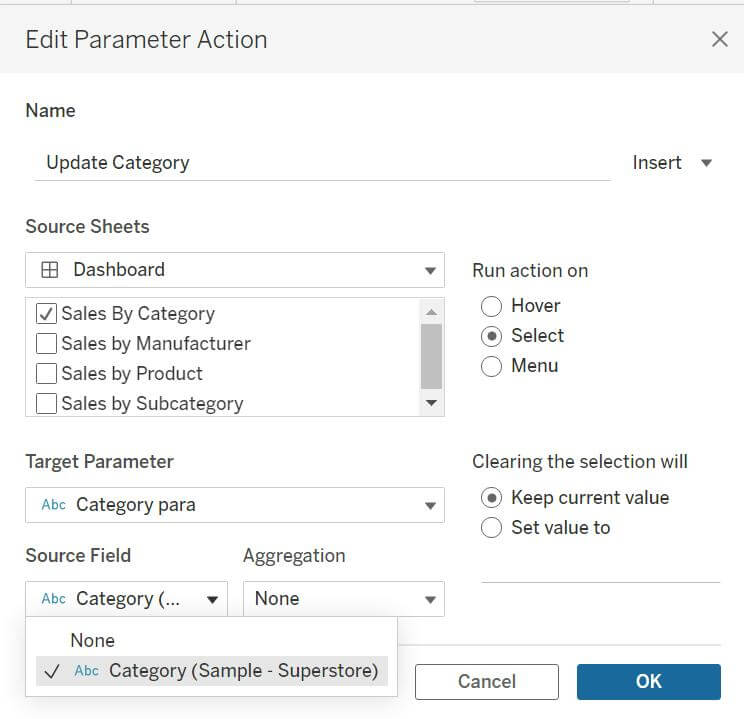
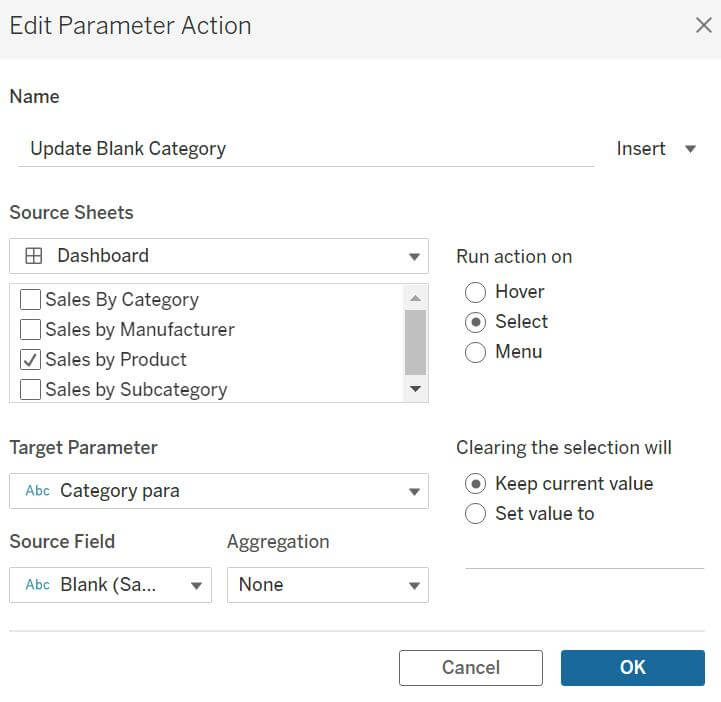
Click on Dashboard – Actions – Change Parameter value.
- Parameter action to update the blank category parameter when clicked on a particular category.
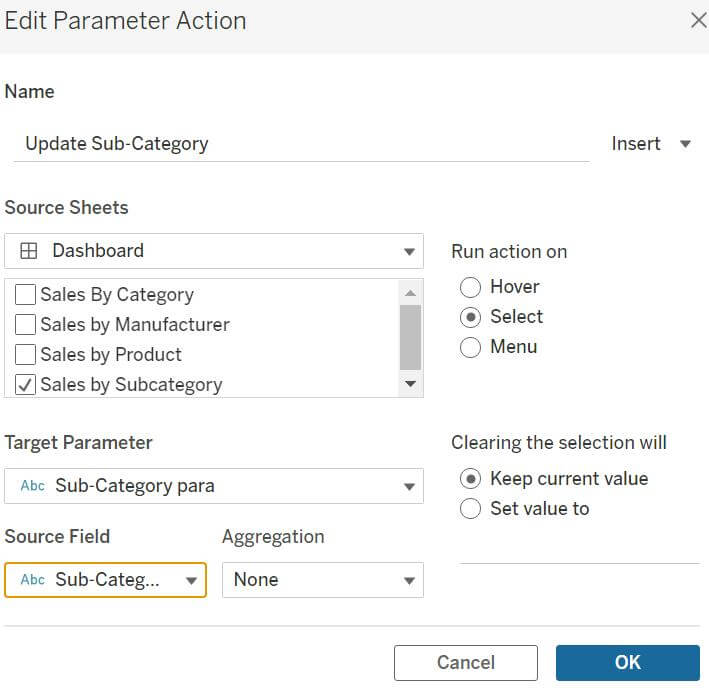
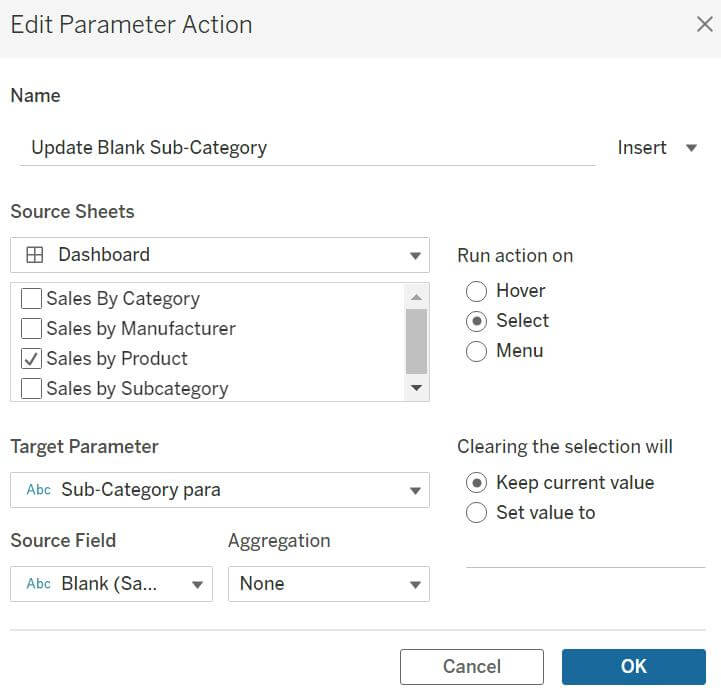
- Parameter action to update blank Sub-category parameter when clicked on a particular Sub-category.
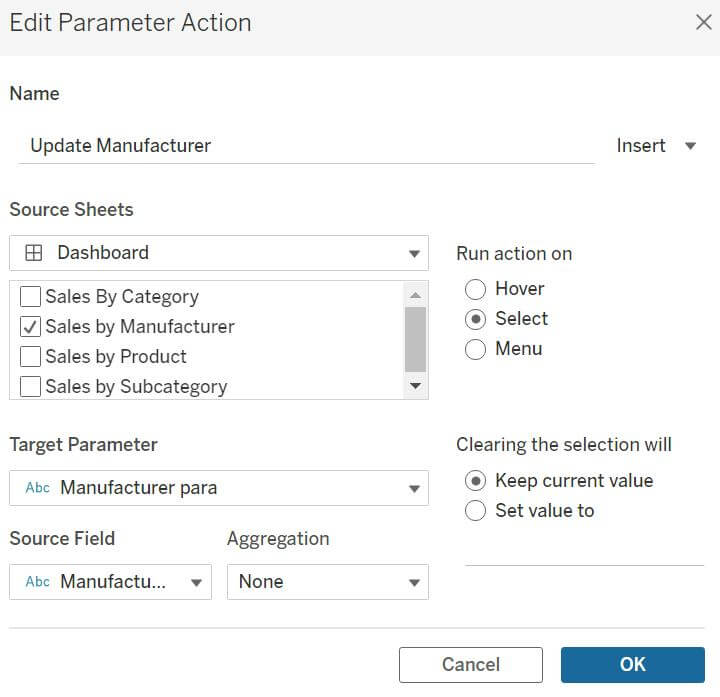
- Parameter action to update blank Manufacturer parameter when clicked on a particular Manufacturer.
- Parameter actions to make Category, Sub-category, and Manufacturer parameters Blank again when we want to go back to the Category level by clicking on any Product.

Now that we have completed all the steps, it’s time to test it.
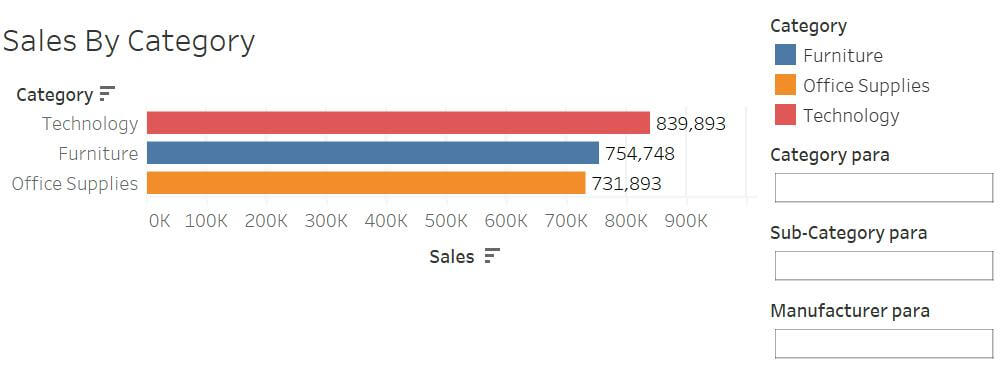
Currently we see all three parameters are blank. Click on any Category in Bar chart.
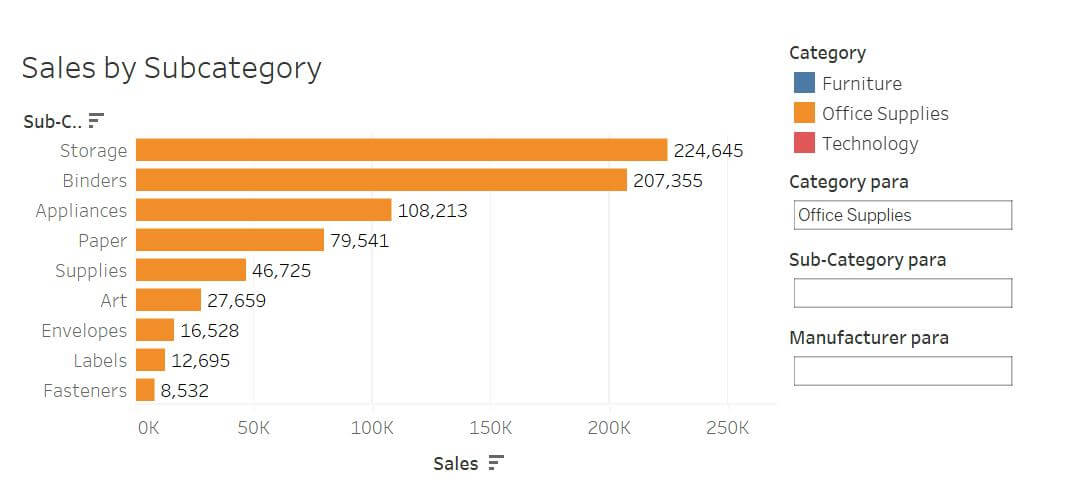
We notice Category Parameter is updated. Now click on any Sub-category.
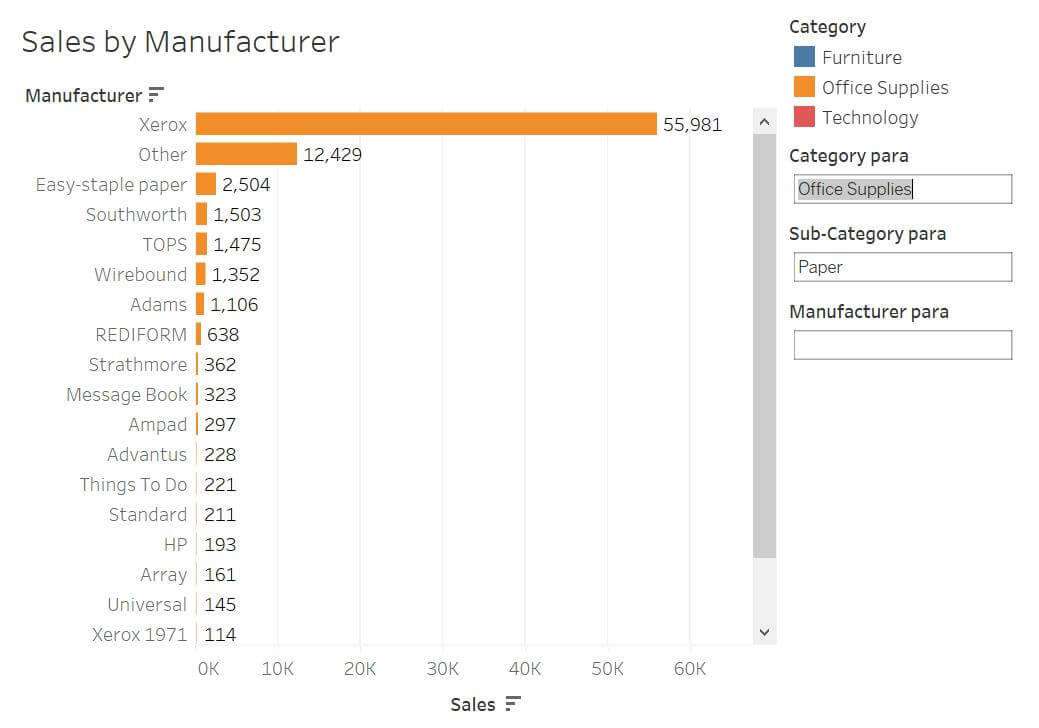
Sub-Category Parameter also gets updated with the selected one. Now click on any Manufacturer.
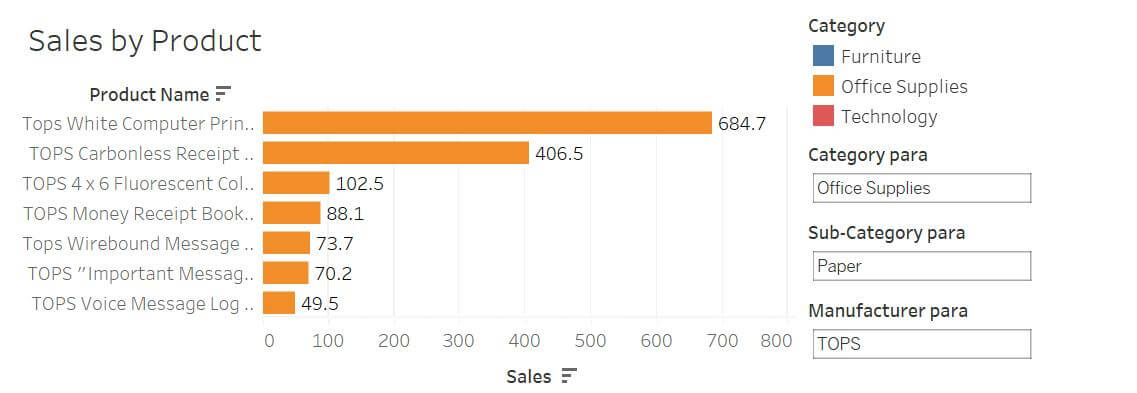
Manufacturer Parameter gets updated. To go back, click on any product and we will go back to the category bar chart with all blank parameters again. We can hide these parameters in the view, as per the requirements.
In conclusion, with Dynamic Zone Visibility, you can create more unified, focused dashboards where every inch of space has purpose. As you continue building out analytics content, experiment with revealing and hiding elements to strike the right balance of depth versus space. Just remember – not all visibility needs to be static!
End