Media Coverage
 Press Release
Mastering Multi-Select Parameters in Tableau
A Comprehensive Guide to Tableau’s Multi-Select Parameters
Unlocking Advanced Analytics: Multi-Select Parameters in Tableau
To be or not to be… a filter, but a parameter?
As we design our dashboards, we frequently contemplate a fundamental question regarding the distinct approaches for user interaction with visualizations. The choice between these approaches depends on the desired impact of the interaction and necessitates a well-considered strategy that acknowledges the limitations of each option.
In many cases, a key factor tends to expedite our decision-making process. We often find ourselves quickly leaning toward one option: Do we require a multi-select feature, or can we work with a single selection mechanism? While this typically summarizes our decision-making, this blog aims to explore and somewhat blur the distinction between a filter and a parameter.
Filter like parameter
By default, a parameter is typically a single-select entity, meaning it can have only one value from its list or range in use at any given time. This is one of the primary reasons why designers often overlook filters, as filters fulfill the requirement for selecting multiple values. However, what sets a parameter apart is its unique ability to access data in a less intrusive manner by serving as a reference variable. Unlike a filter, a parameter does not include or exclude any rows from the view.
Achieving the best of both worlds may have seemed like an unattainable aspiration. However, there is a method that can turn this wish into reality and elevate our visualization techniques to the next level. Excited to learn more? Let’s explore an example that demonstrates how this can be accomplished.
Optimizing Data Visualization
Step-by-Step Guides for Tableau Users
Enhance Analytics with Multi-Select Parameters
Step-by-Step Tutorial: Creating Multi-Select Parameters in Tableau
Enhance Your Data Visualizations: Multi-Select Parameters in Tableau
Use Cases for Multiple Select Parameters
Multiple select parameters offer flexibility in improving parameter functionality and design on dashboards. There are various use cases for multiple select parameters:
- You have to use a parameter across multiple data sources
- You want to create a chart legend that also acts as a selector
- You want to be able to select multiple levels for scenario planning
- You just want multiple selection parameters
Scenario:
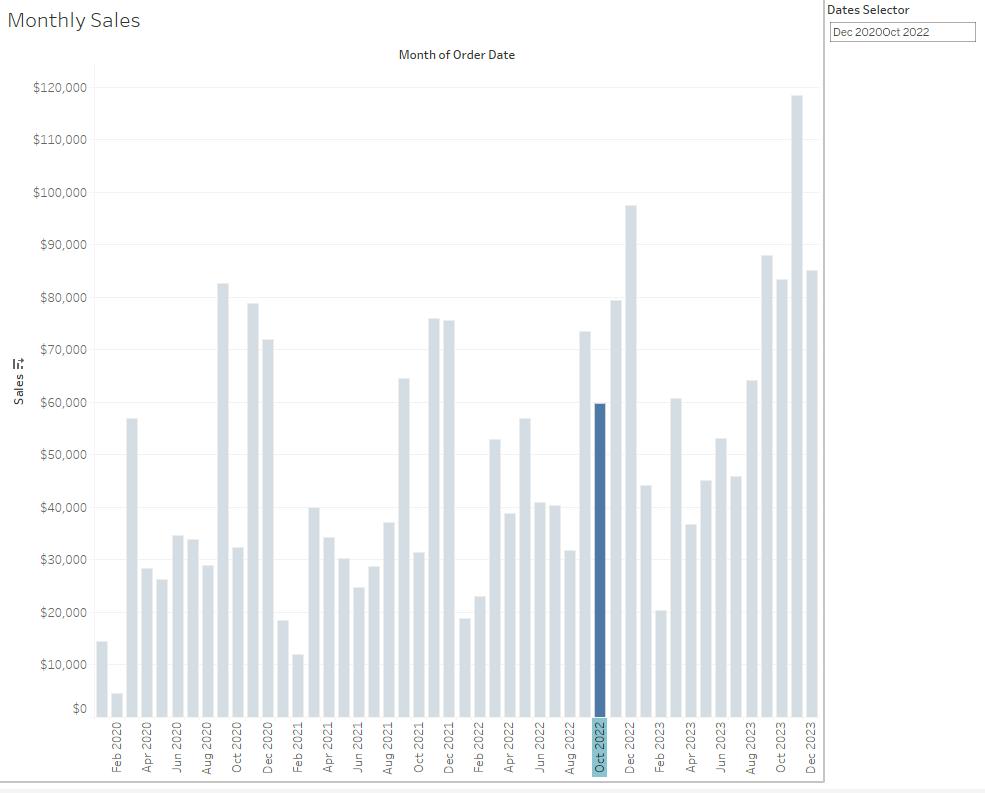
We have a bar chart displaying monthly sales, and we need to enable users to select a custom date range while still displaying all dates that fall outside of their selection.
Utilizing a filter to establish the date range won’t meet our needs, as it would lead to the exclusion of dates outside the selected range from the view. The following steps will outline a method that can help us achieve this goal using a parameter.
Step 1
To begin, we will create the initial bar chart by using [Sales] as a measure on the Rows shelf. Next, we will place the year and month of [Order Date] on the Columns shelf, following the configuration shown in the image below.
![Year and month of [Order Date]](https://www.useready.com/wp-content/uploads/2023/11/year-and-month-of-order-date-select-parameters.jpg)
Step 2
Before we proceed with creating a parameter, we will first generate a calculated field named [Date String]. This field will consist of a concatenation of the month and year components of individual dates, represented as a string type, with some slight formatting adjustments.
The primary rationale for converting the dates into strings is that it simplifies the process of using labels like “Jan 2023” to represent entire months within a parameter. This is more convenient than attempting to use a date type, which would refer to individual dates (e.g., 2/01/2023) rather than entire months.
Step 3
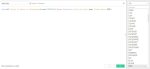
Create a parameter called [Dates Selector]
![Create a parameter called [Dates Selector]](https://www.useready.com/wp-content/uploads/2023/11/Create-a-parameter-called-Dates-Selector.jpg)
Step 4
Given that we are required to select two dates from the entire range, it is important to keep track of the total number of dates selected. To do this, we will create a calculated field called [Count of Dates in Parameter].
![create a calculated field called [Count of Dates in Parameter]](https://www.useready.com/wp-content/uploads/2023/11/create-a-calculated-field-called-Count-of-Dates-in-Parameter-150x45.jpg)
In this calculation, each row is examined to determine whether the [Date String] value matches any entry within the [Dates Selector] parameter. If a match is found, the corresponding [Date String] value is recorded. After checking all rows, the outer calculation conducts a count distinct of all [Date String] values recorded in the [Count of Dates in Parameter] column, presenting it as a single numeric value for the entire column. The FIXED Level of Detail (LOD) ensures that this total count distinct value is displayed as a single number throughout the entire dataset.
We are now ready to create a mechanism that will push the date selections into the [Dates Selector] parameter using an action.
Step 5
In this step, we will generate a dashboard based on the current worksheet. To do this, create a dashboard and insert the worksheet into the page. Afterward, return to the worksheet view and establish a calculated field named [Select Dates Action].
![establish a calculated field named [Select Dates Action]](https://www.useready.com/wp-content/uploads/2023/11/establish-a-calculated-field-named-Select-Dates-Action-150x43.jpg)
As observed in this calculation, we initially verify whether the total count of selected dates is less than 3. Simultaneously, we check if the chosen date does not already exist in the [Dates Selector] parameter. Only if these conditions are met and the date doesn’t duplicate an existing value, the [Dates Selector] parameter value is updated to be [Dates Selector] + [Date String].
Additionally, it’s crucial to highlight that the third line of this calculation examines whether the [Count of Dates in Parameter] is equal to 3. If it is, the [Dates Selector] parameter value will be replaced with an empty character. In other words, the content of the [Dates Selector] parameter is cleared when three dates have been selected.
IMPORTANT: It is crucial that we acknowledge the following two key points about the calculated field [Select Dates Action]. These are.
1. [Select Dates Action] produces dynamic output, which becomes an input to the parameter [Dates Selector].
2. [Select Dates Action] is the equivalent of the dimension [Category]. It is a field that is only called upon by the parameter action object at the time a user interaction is triggered.
Step 6
The next step involves setting up an action within a dashboard using the previously generated calculated field, [Select Dates Action]. To accomplish this, begin by creating a dashboard and adding the Monthly Sales worksheet to the page. Afterward, include the parameter [Dates Selector] in the view.
Step 7
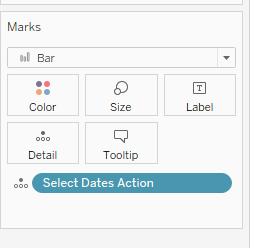
Before establishing a parameter action to input date selections into the parameter, it’s essential to make sure that the correct logic is associated with this action. To achieve this, revisit the Monthly Sales worksheet and, in the Marks card, drag and drop the previously created [Select Dates Action] into the Details box. If this calculated field is not included in the Marks card, it won’t be possible to define the logic while creating the parameter action. This process will become clearer in the subsequent step.
Step 8:
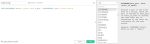
We are ready to create an action to change the parameter values. To do this, we will go back to the dashboard and select from the menu, Dashboard -> Actions…
Then in the following pop-up window, select Change Parameter from the Add Action picklist.
In the Edit Parameter Action window, complete the form as per the image below.
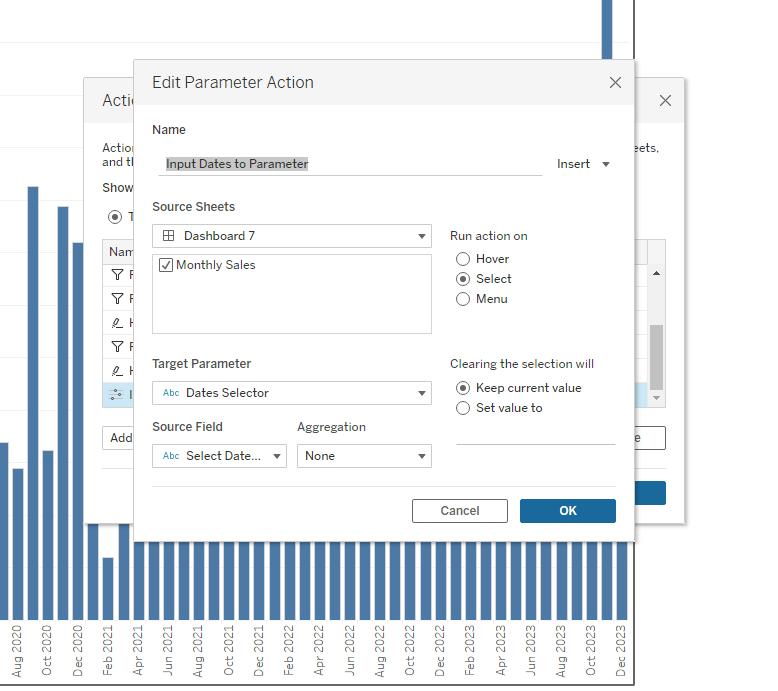
In the “Field” section, we reference the [Select Dates Action] calculated field, which we previously added to the Marks card in the Details box of the worksheet. If this pill was not placed in the Marks card, it won’t be available for selection in the Field picklist in the window shown above.
Recalling our earlier discussion on parameter actions, the “Field” contains the name of the dimension whose selected value is assigned to the parameter. In our Monthly Sales example, we are utilizing the calculated field [Select Dates Action], which dynamically supplies its output to the parameter.
![the calculated field [Select Dates Action]](https://www.useready.com/wp-content/uploads/2023/11/the-calculated-field-Select-Dates-Action-150x78.jpg)
Using the above illustration as an example, here is the breakdown of what really happens when a user clicks on a [Date String] value from the above bar chart.
1. User interacts (clicks) a month from the chart. That month value is selected.
2. Parameter action is triggered and the [Select Dates Action] calculated field is called.
3. As per the description in Step 5, total count of dates present in the parameter is checked along with a check to see if the selected month (above) has a matching value in the parameter [Dates Selector].
4. If the total count of dates present in the parameter [Dates Selector] is less than 3 and the selected month does not exist in the parameter, then the output of [Select Dates Action] is the concatenation of the existing value in the parameter and the selected month.
5. If the total count of dates present in the parameter is equal to 3, then the output of [Select Dates Action] is an empty character.
6. The output from [Select Dates Action] is then pushed to the parameter.
It is evident from this example alone that we can exercise so much flexibility simply by incorporating the required logic inside a calculated field and associating it with the parameter action.
Step 9
Let’s now go through the complete process of using the parameter action to populate the [Dates Selector] parameter with two-month values and observe the result when adding a third month value to the parameter.
To begin, click on the month of December 2020 along the date axis.
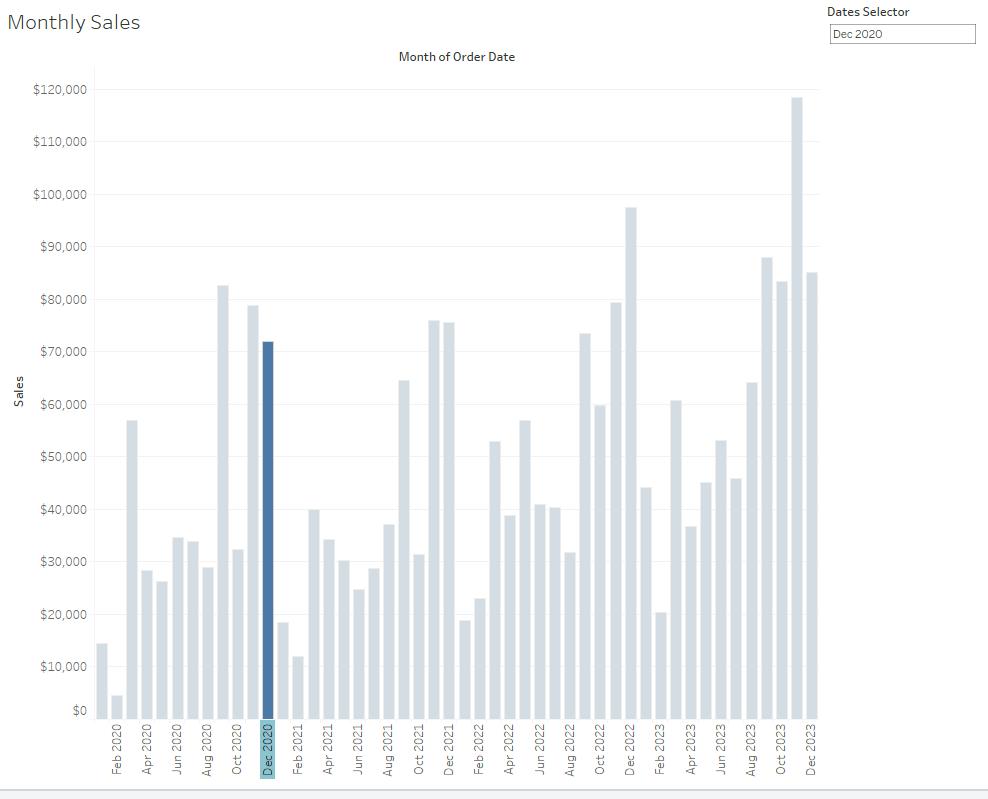
We can verify from [Dates Selector] that the month of December 2020 has been added to the parameter. As of now, we have selected only one month, and one more choice remains.
For the second month, let’s pick October 2020. You can do this by clicking either on the month label or the corresponding bar itself.
Note [Dates Selector] now contains both Dec 2020 and Oct 2022. So that is a success!
However, given that we only need to input two end points of a date range, we don’t need a third month as an input. We will observe what happens when another month is selected.
For this test, we will select Jan 2023.
We see that with Jan 2023 being selected, [Dates Selector] becomes cleared. Good. This is exactly the behavior we anticipated.
Step 10
Now that we’ve successfully added two month values to the parameter [Dates Selector], we can use this capability to impact the visualization.
In this example, we’ll opt for a visualization effect that highlights the months within the two selected months while fading out those outside the selection.
To achieve this, we’ll begin by establishing reference dates at both ends of the selected range. We’ll create two calculated fields as follows: [Min Date] will serve as the start date of the selected range, and [Max Date] will define the end date.
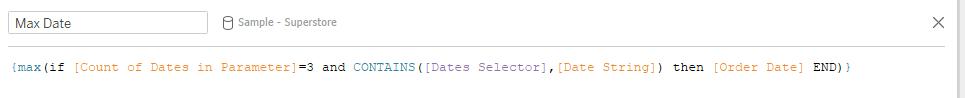
In these two calculations, we begin by examining each row to determine whether the [Date String] value is included within the contents of the [Dates Selector] parameter.
It’s important to highlight that one of the initial conditions in these calculated fields checks if [Count of Dates in Parameter] equals 3. This count of 3 indicates that there are two [Date String] values in the [Dates Selector] parameter, signifying that these two calculations will only be executed when both months are present in the parameter.
Based on our earlier example where the two months selected were Dec 2020 and Oct 2022, both calculations above will check if [Date String] is either a Dec 2020 or Oct 2022 at each row and in instances where they are, the instruction is to then register that particular [Order Date].
Step 11
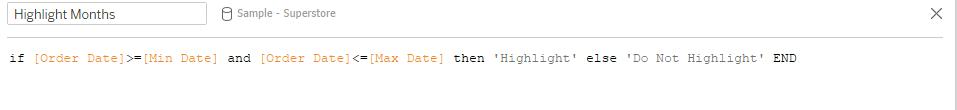
Now that we have created the [Min Date] and [Max Date] fields, we will generate a calculated field called [Highlight Months]. This field will be used to identify the rows where the [Order Date] falls within the range defined by [Min Date] and [Max Date], controlling the color assignment.
Step 12
We will now apply the newly created calculated field [Highlight Months] to the Marks card to generate a contrasting color effect for the bar chart.
To do this, drag and drop the field [Highlight Months] to Marks card and into the Color box. Then click on the Color box to access the menu.
![drop the field [Highlight Months] to Marks](https://www.useready.com/wp-content/uploads/2023/11/drop-the-field-Highlight-Months-to-Marks-150x52.jpg)
Then assign a light shade for the Do Not Highlight type, while selecting a darker colour for the Highlight type to create the contrast.
Once the colours are assigned, the dashboard will update to display the following view, which gives the impression that the months in blue are the range in review, while the bars shown in grey are irrelevant.
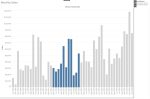
Now, we have one final check to perform before considering the dashboard complete. As discussed earlier, we want to ensure that the [Dates Selector] parameter is cleared when another month is selected while two dates are already present, as shown in the image above.
To test this, you can simply click on another month and observe the behavior.
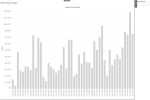
As expected, selecting a third month resulted in [Dates Selector] parameter being cleared of its content and as a result, all the bars have been reassigned a grey shade.
This is essentially how we can imbue a parameter with the superpower of multiple selection. By incorporating a calculated field to handle the logic and syncing it with a parameter action, we’ve seen how a parameter can take on a key capability typically exclusive to filters.
While parameters and filters may seem distinct at first, a closer examination reveals that their capabilities can intersect under the right circumstances. With the technique outlined here, we’ve effectively blurred the line between these two entities and expanded the potential of parameters. The multi-select parameter grants designers greater flexibility and interactivity in dashboard creation. This opens new doors for advanced parameter actions, creative highlight effects, and beyond. Hopefully this post provides a solid foundation for leveraging multi-select parameters in your own dashboards.
Stay tuned for additional examples in future blogs!