


 Media Coverage
 Press Release
Mastering Housing Prices Regression Techniques
A Comprehensive Guide to Predictive Modeling for Housing Prices
Unlocking the Power of Regression Analysis for Real Estate Markets
Housing Prices Regression, Machine Learning, Linear Regression Model, House Price Prediction, Dataiku, Random Forest
Hey fellow Data Science enthusiasts, today I would like to give you a glimpse at my take on solving a regression problem to predict housing prices. This is yet another of those classic datasets that Data Scientists of all caliber work on with varying levels of modeling approaches. However, what I find interesting is the level of detailed effort you could put into this data to experiment with what works and what does not. So, without any further delay –

Introduction to Housing Prices Regression Techniques
Understanding Different Regression Models for Predicting Housing Prices
Data Preprocessing and Feature Engineering for Housing Prices Prediction
Evaluating Model Performance: Metrics for Assessing Housing Prices Regression Models
Preview: The data
The dataset consists of about 79 explanatory variables describing (almost) every aspect of residential homes in Ames, Iowa, and the variable to predict is the price of each house. I used Dataiku for data cleaning and feature engineering which reduced the time spent on each of the aspects by at least half of what I would have spent through traditional python programming.
Step 1: Explore the data
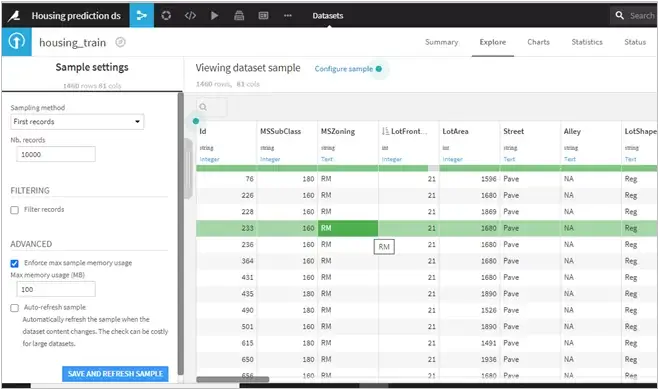
During the initial data exploration stage, we are trying to understand the different variables in the dataset than getting right into statistics or graphs.
Here are a few observations:
- There are a couple of similar features describing Lot such as LotFrontage, LotArea, LotShape, LotContour
- OverallQual and OverallCond are ratings for each of the houses on a scale of 1 to 10
- There are dates of “YearBuilt” and “YearRemodelled”
- There are a few categorical variables that describe the type of foundation or the basement type etc.
- We also have utilities like CentralAir, Electrical, Heating, etc.
- And finally, the majority of columns describe the number of full/half bedrooms and bathrooms, garage, kitchen, and living area, etc.
Step 2: Exploratory Data Analysis
At this stage, there were a few assumptions regarding what could affect the sale price. This prompted me to check whether the assumptions had a pattern using graphs and other visual mediums.
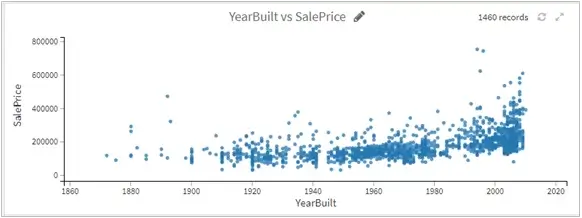
- It turns out the year built did affect the price of the house as logically newer homes are costlier to build and hence sold at higher rates. (note the exception of outliers here)
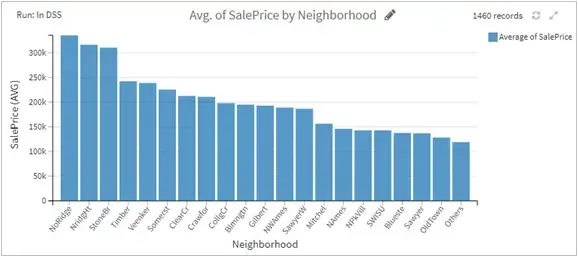
- The above chart suggests some neighborhoods are costlier than others and hence it’s better to group them since the differences between some of them are pretty small
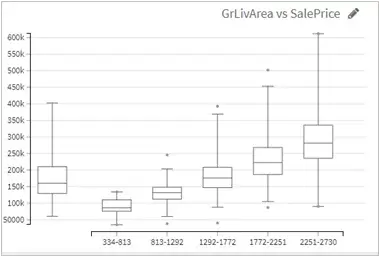
- Box plots serve as a great way to identify outliers which might skew the results vastly. As an example, the relationship between “greater living area” and “sale price” shows how some houses might be priced lesser than average even within the same area range.
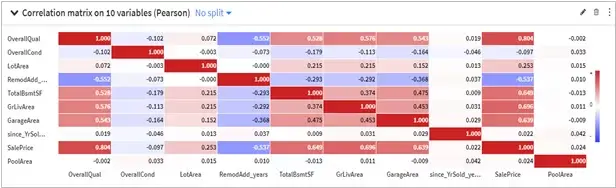
- A correlation matrix also helped me to judge the strength of the relationship between variables with each other along with sale price.
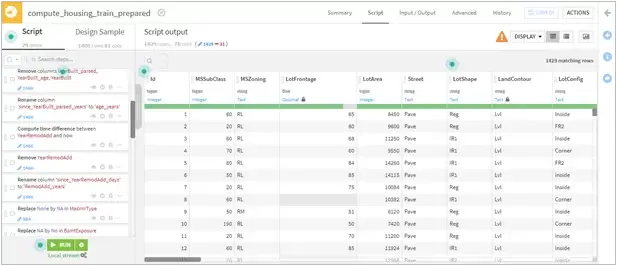
Step 3: Data Preprocessing
- Data conversions of years into age since it gave a better continuous flow and cleaning misspelled data types such as ‘Twnhs’ and ‘Twnhse’ for “Townhouse” in BldgType.
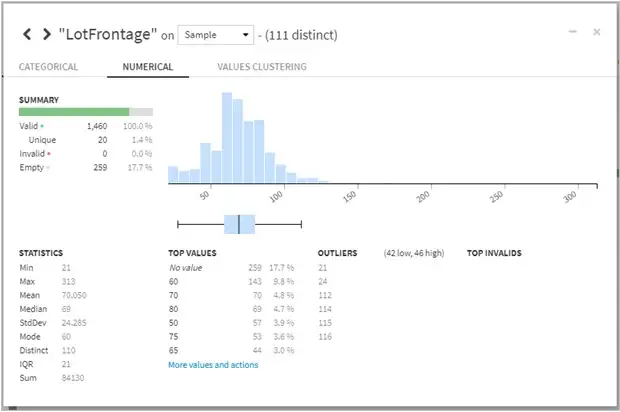
- Imputation of null values: In this step, we filled missing numerical such as LotArea with the mean value and most repeated values for categorical variables like Pavement.
- Removing outliers: Outliers were removed from the range of 5* Inter-Quartile Range (classic Tukey method takes 1.5 * IQR) which helped in eliminating skewed data.
- Used One hot encoding approach for categorical variables with less than 4 categories.
Step 4: Modelling
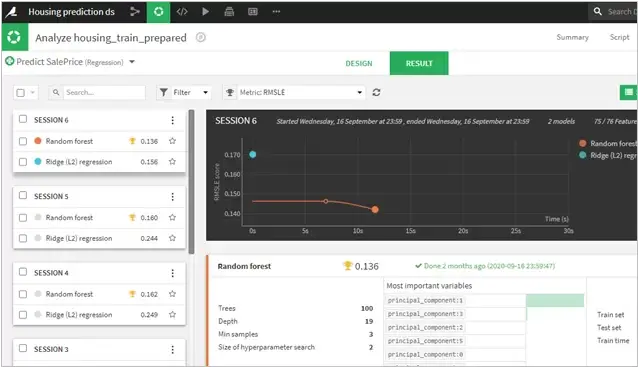
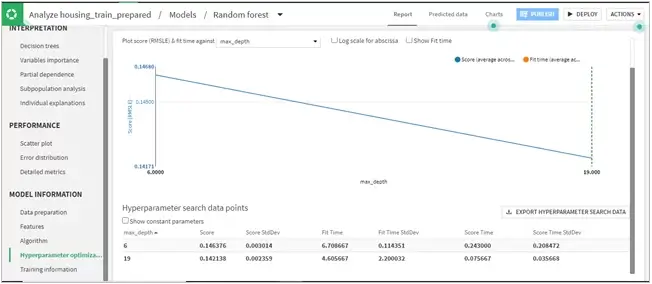
- Considering it a regression problem, I modeled the train data with Random Forest, Ridge (L2) regression, and XGBoost techniques. While L2 produced similar results as Random Forest, however with hyperparameter optimization Random Forest gave a stronger accuracy and less error within a reasonable time limit (sorry XGBoost!)
- With a decent number of trees and max depth of 19, the model gave an R2 score of 0.895 and RMSLE of 0.136 which was pretty good.
- See figure below, as RMSE is less for max depth of 19 than 6 which reduces the error in our model.
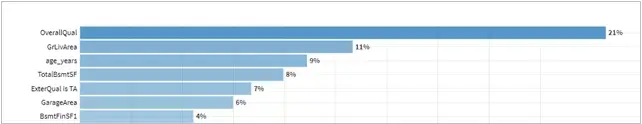
- Further, the importance of the variables showed that the Overall Quality of the house, Greater Living area size, and Old Homes were preferred more than the rest of the factors.
Step 5: Interpreting scoring and other factors
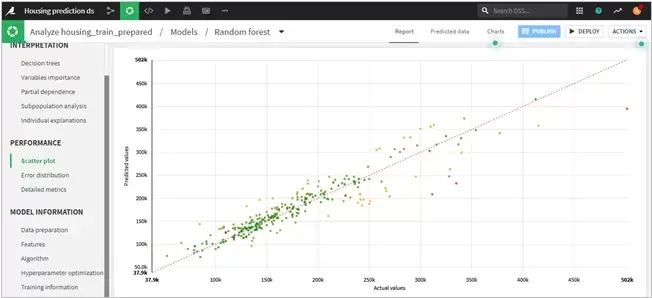
- Random forest model helped in avoiding over-fitting of training data which paired well with hyperparameter optimization which proved to be the correct approach. The scatter plot gives an indication of error between the actual value and the predicted values of the dataset.
- The effect of this is that the model introduces more bias but becomes more statistically stable and invariant. In other words, it prevents us from overfitting and is better able to generalize to new data.
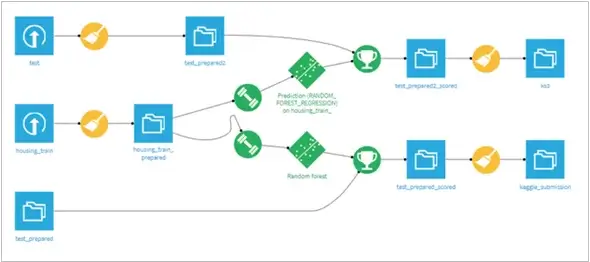
The final model and entire design was created using Dataiku and was intuitive and easy to use. The below figure shows us exactly how.
- Data ingestion with the training data and applied data preparation techniques on the training data
- Model creation(Dataiku also provides easy to implement AutoML modeling feature so you can sit back and relax and let AutoML handle your worries!)
- Scoring with the available test data
- Finally, preparing the output data to post to Kaggle Community and share the accomplishment with other fellow Data Science enthusiasts!
Linear Regression: The Foundation of Predictive Modeling for Housing Prices
Advanced Regression Techniques for Improved Housing Prices Predictions
Feature Selection and Dimensionality Reduction in Housing Prices Regression
Practical Tips for Building Robust Regression Models for Real Estate Data
Conclusion
Predicting housing prices is a great tool for many realtors and even seasoned home buyers. Experts attribute this to accurate linear regression / logistic regression models, combined with innovative machine learning – giving realtors a fair ballpark price with reasonable judgment.
My approach involved more explainable models than high accuracy black box models. Something to factor in is how the peculiarity of a certain house (antiquity or exquisite architecture) could result in outliers and hence drive the prices to skyrocket.
There are many more areas to explore and techniques to experiment with, for instance, if we consider data like crime rate and even access to local market could always result in more accurate predictions. I hope to continue to learn and gather deeper insights with repeated problem solving, even on the same data.
