Media Coverage
 Press Release
Understanding the Power of Rill in BI Development
How Rill is Changing the Landscape of BI as Code
As data platforms and analytics continue to evolve, keeping up with the pace of change has proven to be a bit more challenging than one would’ve liked. In this post, we’ll explore using Rill Data as a potential solution through “BI as code” (BAC) to enable greater agility.
Specifically, I’ll walk you through some steps in terms of getting started with Rill, connecting it to Snowflake data sources, building a simple data model, creating metrics and visualizations, and deploying the application.

What is BI as Code (BAC)?
Introducing Rill: A Powerful Tool for BI Development
Advantages of Using Rill for BI as Code
How to Get Started with Rill for Your BI Projects
Understanding the Concept of BI as Code
Why Rill?
I liked how easy it was to get started with Rill data on my local sandbox. And the development of “Models”, coming from a background who likes “dbt”. And how easy it is to develop charts similar to Streamlit.
Who Can Use Rill?
Rill is for those who can tick of any of the following requirements on their checklists.

Programmatic Analytics

Streaming Analytics

Self Service Analytics

Operational Analytics
Personally, I see Rill for those organizations that wants to ship their BI platform as code. Let me explain what I mean. A typical BI platform would require engineers to set up a pipeline that does the following:

Set up data Source
(Extract & Load)

Build Data Models
(Transform)

Build Dashboards
(Metrics Layer)
Rill can enable all three jobs as a code. I love this part especially since it makes my life super easy to version control everything in a single place and constantly ship my code.
Let’s Build
Follow along the steps to spin up a simple Rill project that connects to Snowflake and develop a simple model and make a viz out of it.
#install Rill
brew install rilldata/tap/rill
#create directory
mkdir rillDemo
cd rillDemo
#Create a Rill project
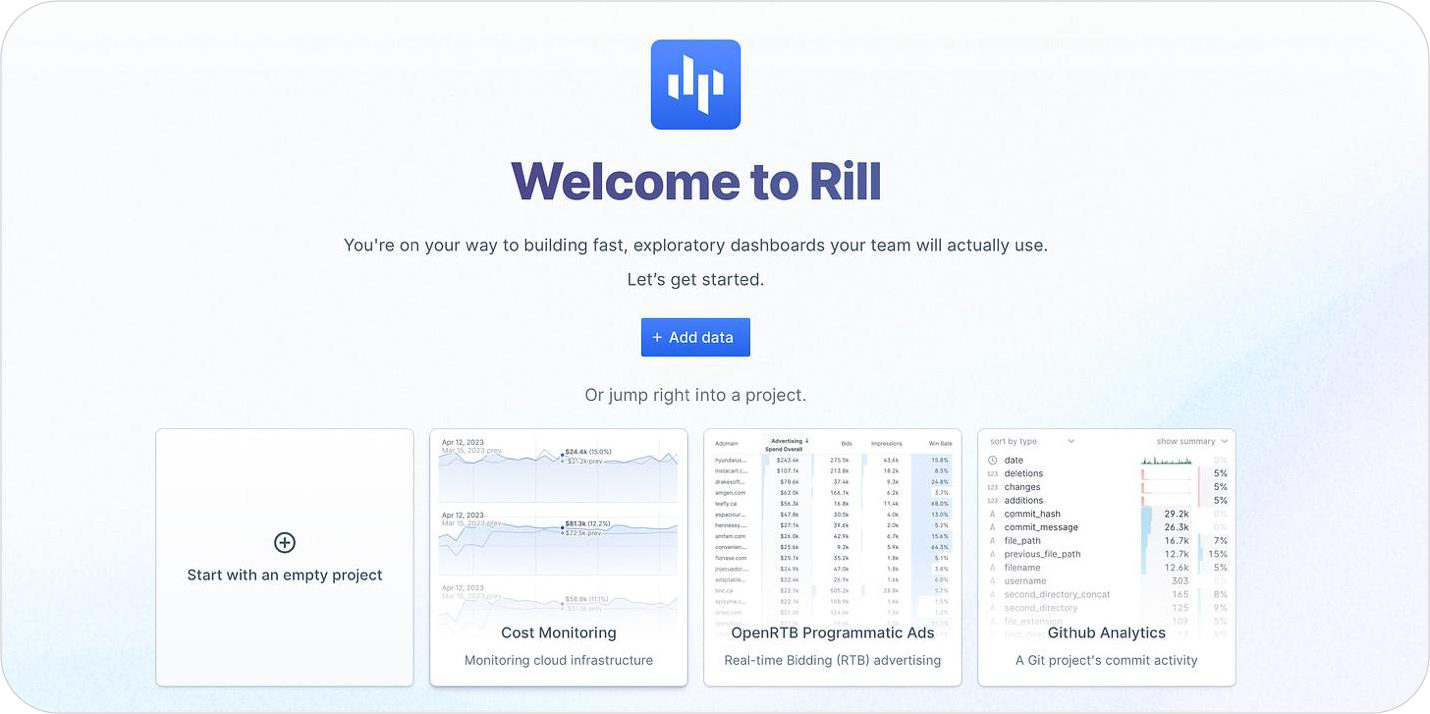
rill start rill-demo-project This would open up this UI on the local host:
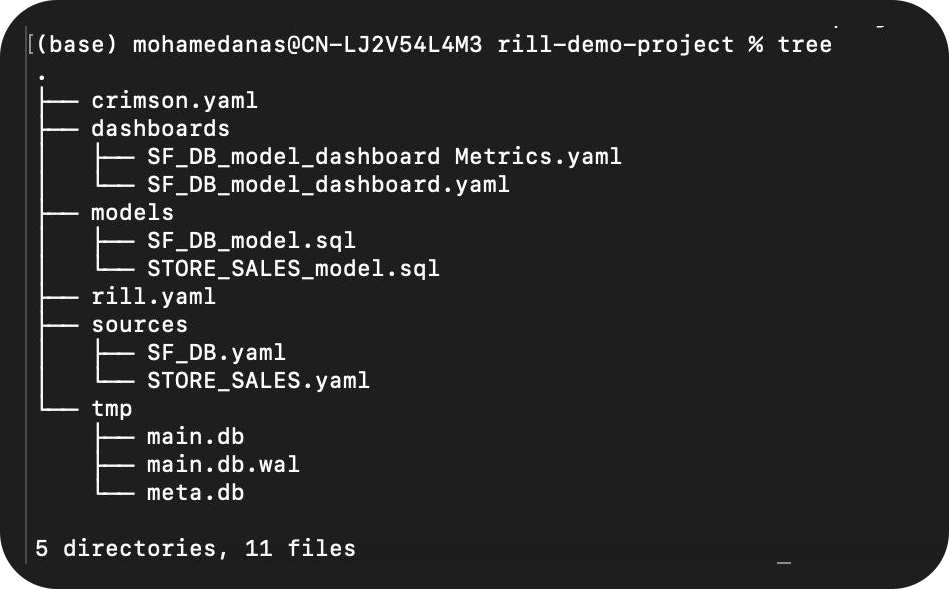
Alternatively, a set of folders would be created in your directory. The tree structure would look something like this:
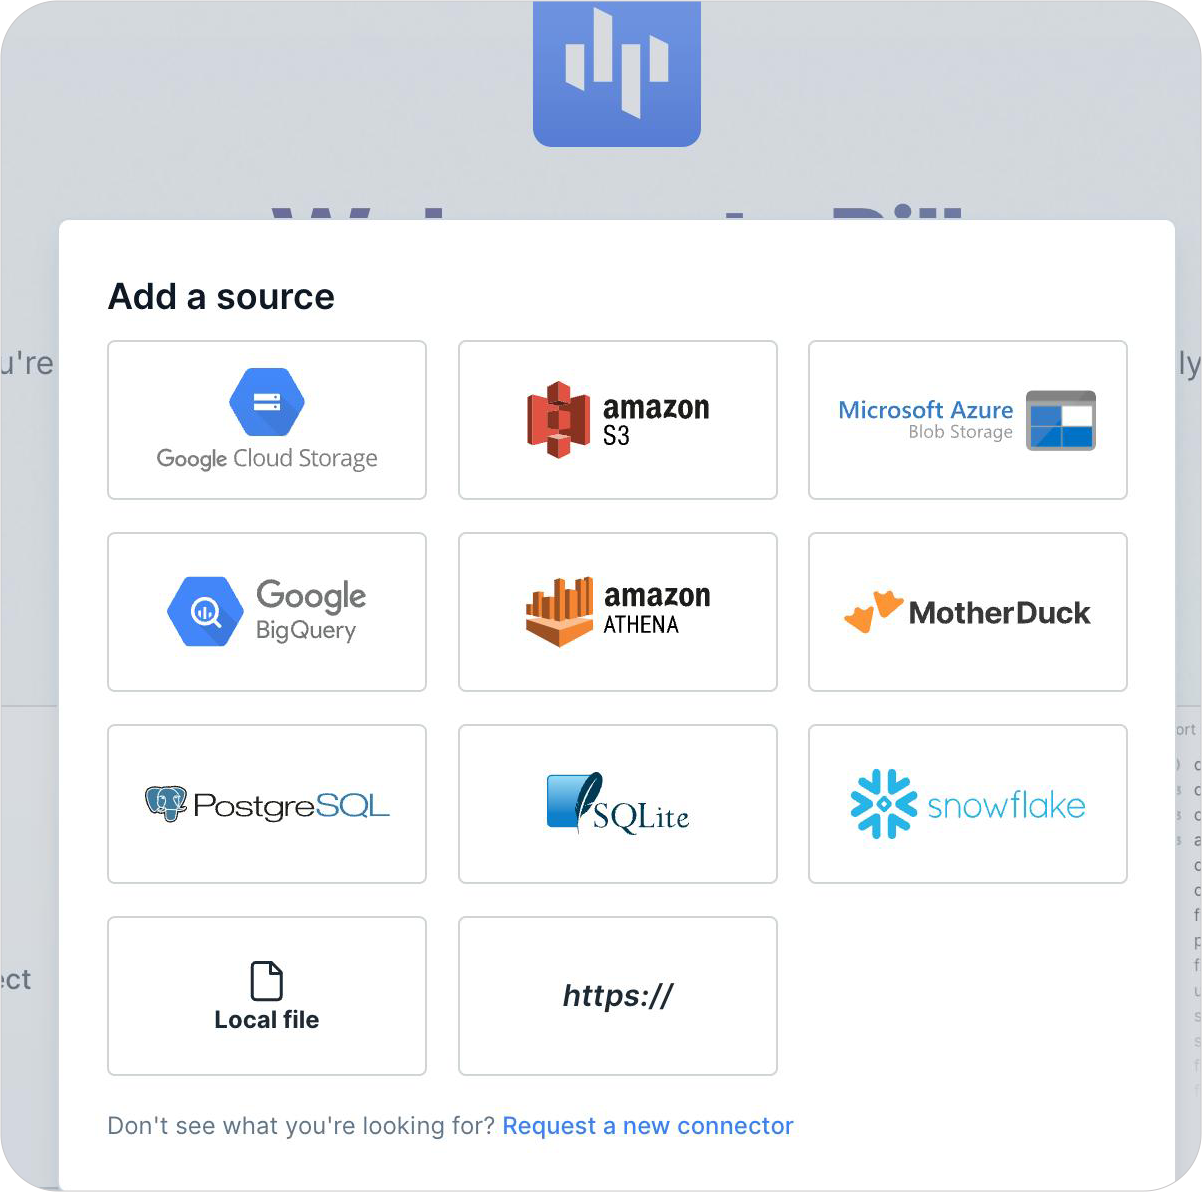
Configuring Snowflake Data Source
Select Snowflake
Sample string to configure snowflake connection. This can also be passed as environment variables.snowflake_user:snowflake_pwd@account_identifier/db_name/schema_name?warehouse=wh_name&role=role_name
Once the source is created, you should see the same source created under your sources folder in your project. I started creating sources in the sources folder and it was pretty straightforward.
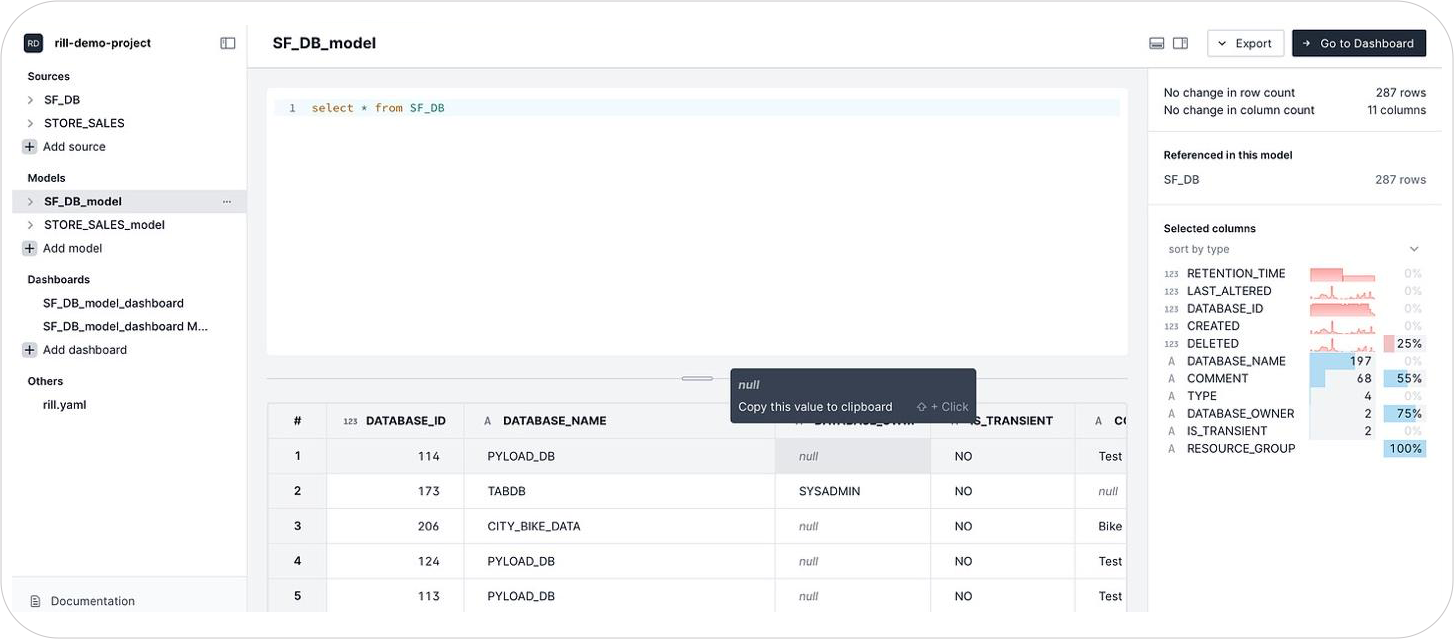
Creating Model
Models are .sql files. We could create one using the UI which creates a simple select* from the source. This is similar to how we create models in dbt. We could pass some custom queries and create a model file by referencing the source. If you have used dbt before it is pretty much the same.
Developing on the UI autosaves the files. However, I used VS code to build this and it was great how I could see what I built immediately.
Creating Dashboards
By clicking on the “Go to Dashboard” icon on the top, rill created a dashboard for me based on the measures and dimensions available on the source.
However, I wanted to create my own dashboard and here’s how this looked after I defined my metrics.
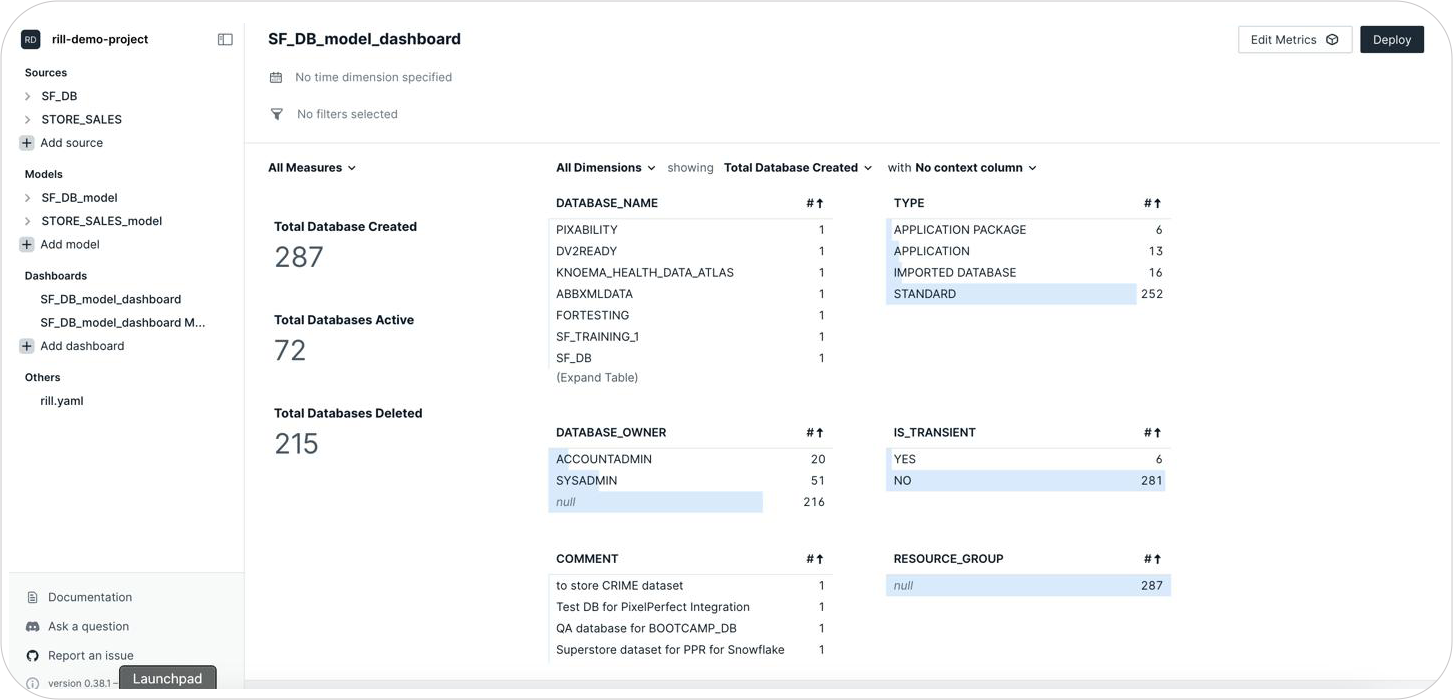
This is how I defined my metrics.
#Rill Metrics for Snowflake Databases

title: SF_DB_model_dashboard
model: SF_DB_model
timeseries: ""
measures:
  - label: Total Database Created
    expression: count(DATABASE_ID)
    name: total_db_created
    description: Total number of db created in the account
    format_preset: humanize
    valid_percent_of_total: true
  - label: Total Databases Active
    expression: count(DATABASE_ID) - count(DISTINCT DELETED)
    name: Active Databases
    description: Total Active Databases
    format_preset: humanize
  - label: Total Databases Deleted
    expression: count(DISTINCT DELETED)
    name: Deleted Databases
    description: Total Deleted Databases
    format_preset: humanize
dimensions:
  - name: DATABASE_NAME
    label: DATABASE_NAME
    column: DATABASE_NAME
    description: ""
  - name: TYPE
    label: TYPE
    column: TYPE
    description: ""
  - name: DATABASE_OWNER
    label: DATABASE_OWNER
    column: DATABASE_OWNER
    description: ""
  - name: IS_TRANSIENT
    label: IS_TRANSIENT
    column: IS_TRANSIENT
    description: ""
  - name: COMMENT
    label: COMMENT
    column: COMMENT
    description: ""
  - name: RESOURCE_GROUP
    label: RESOURCE_GROUP
    column: RESOURCE_GROUP
    description: ""

available_time_zones:
  - America/New_York
  - Asia/Kolkata
Deployment
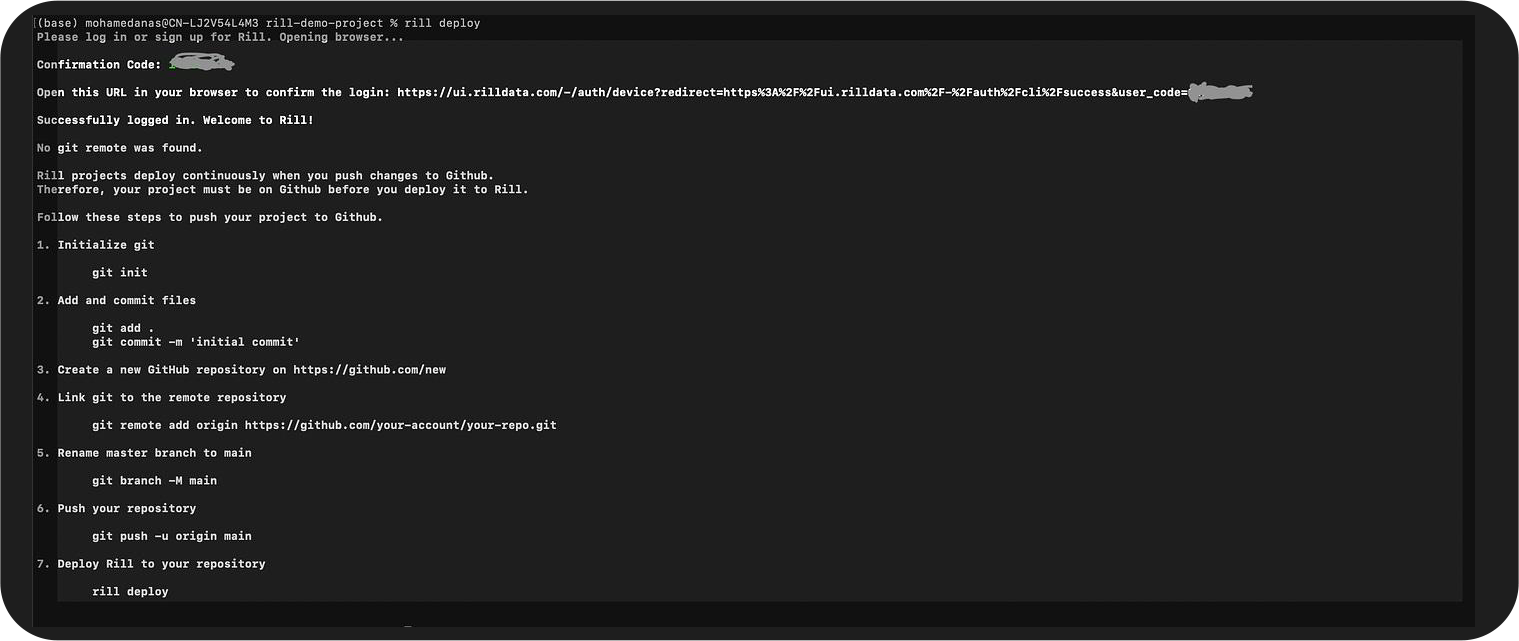
In order to deploy, it took me a series of steps including one where I had to sign-up for a Rill cloud account.rill deploy
After this, it redirected me to open the rill cloud on the browser. I didn’t want to continue further with this deployment (why? I will cover it in the next piece.)
Key Features of Rill for Streamlining BI Development
Case Studies: Successful Implementations of Rill in BI Projects
Tips and Best Practices for Leveraging Rill Effectively
My Learnings
- Rill enables metrics layer on top of your Analytics platform. This can’t be a replacement for complex dashboards (not yet) ✅
- I loved how easy it was for me to create metrics and view it immediately!
- YAMLing the metrics layer was an easy way to build metrics✅
- Documentation on how to build metrics needs more information. It redirected me to duckdb sql functions ❌
- The credentials were not encrypted so I was not comfortable pushing my code to Git. Would love to have a credential store or a password manager❌
- I started my test with TPCDS_SF100TCL which comes with snowflake and the load times were more for big datasets❌
- This could be a great tool if we can integrate dbt models
Conclusion
In summary, Rill shows real potential as a metrics layer and visualization tool for cloud data platforms. Benefits like easy metric definition, code-based project structure, and quick iteration are very promising. However, the lack of encryption, incomplete BAC approach, and performance concerns currently limit its usefulness.
As Rill continues maturing, integrating deeper data transformation and deployment options, and addressing security concerns, it may emerge as a leading ‘BI as Code’ solution. For now, it serves as an exciting vision of the future of analytics infrastructure, even if it isn’t fully production-ready yet.
I’m intrigued to continue exploring Rill’s progress and believe tools like this will be key in sustaining modern data analytics.