


 Media Coverage
 Press Release
Introduction to Apptio Reports and Tableau
In today’s data-driven business landscape, organizations are constantly seeking ways to efficiently analyze and visualize their data to gain valuable insights. Apptio and Tableau are two popular tools that help businesses manage and analyze their data. While Apptio focuses on financial management and analytics, Tableau excels at data visualization and exploration. Migrating reports from Apptio to Tableau can be a smart move for taking advantage of Tableau’s superior analytics and visualization features.
Benefits of Migrating Apptio Reports to Tableau
The Migration Process
Some of the common motivations for migrating reports to Tableau include its richer visualization capabilities and interactive dashboards; ability to integrate data from various sources into Tableau for holistic analysis; and enhanced collaboration and sharing options.
This blog offers users a step-by-step guide for migrating Apptio Reports to Tableau and taking advantage of both Apptio and Tableau’s key features.
Step 1: Data Extraction and Preparation
The first step in the migration process is extracting data from Apptio and preparing it for the transition to Tableau. This involves:
- Identifying the relevant data sets and determining the desired scope of the migration.
- Extracting data from Apptio using Apptio APIs or exporting data in a suitable format (e.g., CSV, Excel).
- Performing data cleansing, transformation, and formatting to ensure compatibility with Tableau.
Step 2: Apptio Report Analysis
Step 1: Login to Apptio
Logging into Apptio
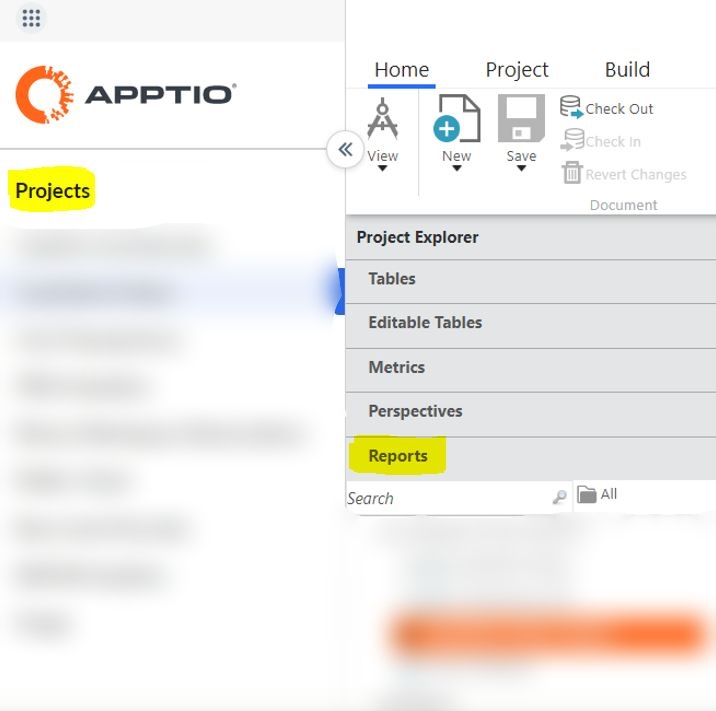
Step 2: Choose the Project from the Projects section and then select Reports from the Project Explorer section to see the report.
Downloading Data from Apptio
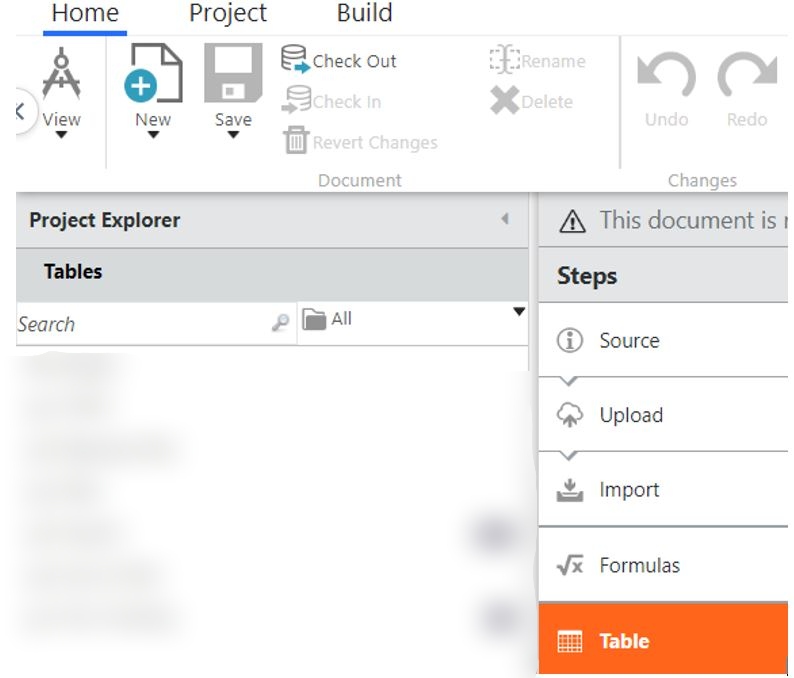
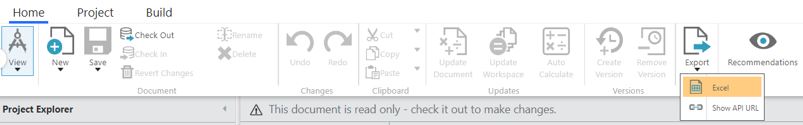
Step 3: To Download the data of any table, select the table, and then export it.
Checking Calculated Fields
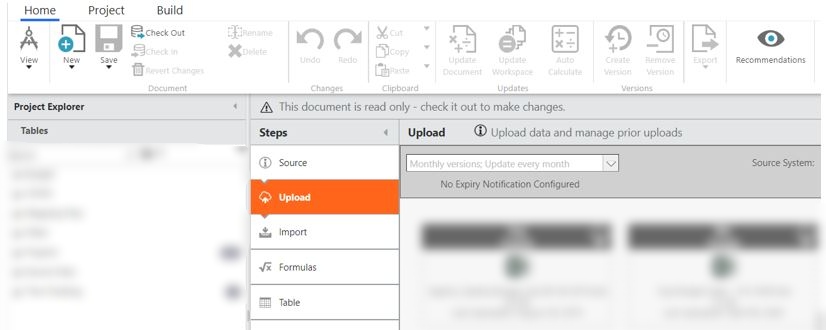
Step 4: You can check the previous data in the upload section.
Step 5: To check the calculated fields, go to the formula section.
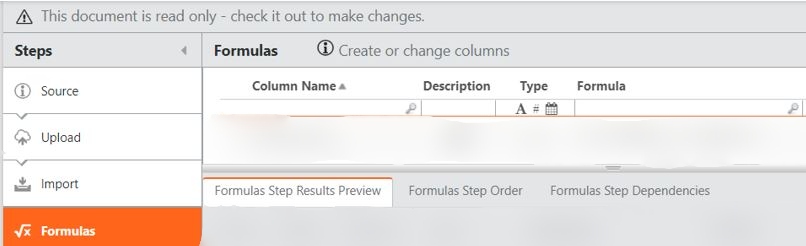
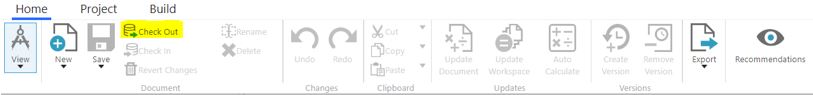
Step 6: To see the hidden filters, click on check out.
Viewing Hidden Filters
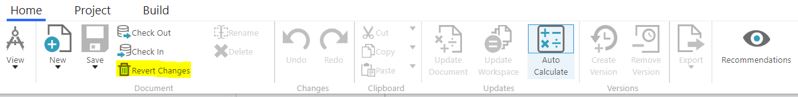
Step 7: After the check out, click on revert changes.
Reverting Changes
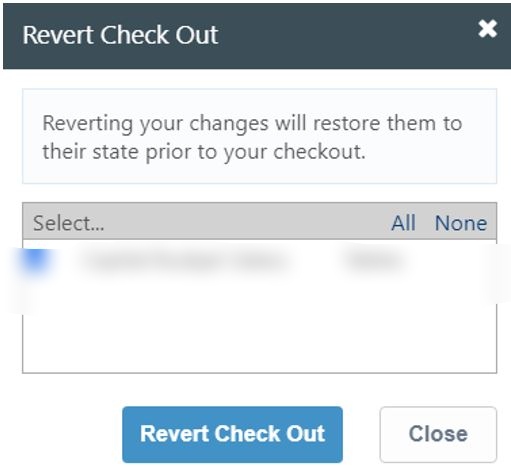
Step 8: After reverting changes click on revert check out.
Formula & Syntax Mapping
Use the right function for calculated fields in Tableau, as Apptio and Tableau have their own set of functions. Below are some examples.
| Field Name | Apptio Formula | Tableau Formula |
| Qty | IF(Flag = “Y”, Quantity, 0) | IF [Flag] = “Y” THEN [Quantity] ELSE 0 END |
| Aggregated Salary | SumIf(Flag2,”Y”, Salary) | { FIXED : SUM( IF [Flag2] = ‘Y’ THEN [Salary] END)} |
| Filter | IF(SEARCH(“Y”, Flag3) > 0, 1, 0) | IF CONTAINS([Flag3],”Y”) THEN 1 ELSE 0 END |
| Start Date Int | Minutes(Start Date) | DATEDIFF(‘minute’, MAKEDATE(1970,1,1), [Start Date]) |
| Flag4 | Flag&&Flag2&&Flag3 | [Flag]+” – “+[Flag2]+” – “+[Flag3] |
Step 3: Migration to Tableau
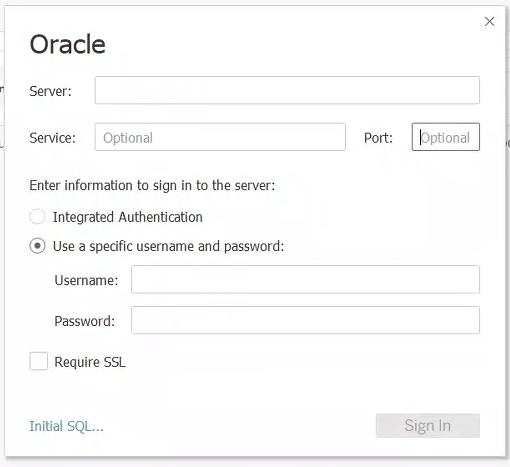
Step 1: Login to Tableau
Open the Tableau desktop and connect to any file (e.g. Excel, CSV) or give the correct server’s name, username, and password to connect with any Server.
Step 2: Data Modeling and Structure
Tableau follows a different data model and structure compared to Apptio. During migration, redefining the data model and structure is essential to align with Tableau’s requirements. This involves:
- Designing an appropriate data model that accommodates the desired analysis and reporting needs.
- Mapping Apptio data fields to Tableau data fields, ensuring data consistency and accuracy.
- Establishing relationships between data tables and defining appropriate joins in Tableau.
Preparing Visualizations in Tableau
Unlocking the Power of Tableau
Seamlessly Integrating Data Sources
Advanced Analytical Tools
Step 3: Go to the sheet and prepare your viz on Tableau.
Migrating reports from Apptio to Tableau offers organizations a powerful combination of financial management, analytics, and data visualization capabilities. By following a structured migration process, organizations can seamlessly transition their financial data to Tableau and unlock a wealth of benefits. With Tableau’s advanced visualization capabilities, they can create intuitive dashboards and reports, facilitating better data exploration and decision-making. Furthermore, Tableau seamlessly integrates with various data sources, including databases, spreadsheets, and cloud-based platforms, allowing organizations to consolidate data from multiple sources for comprehensive analysis. Moreover, Tableau’s analytical tools, such as advanced calculations, forecasting, and predictive analytics, enable organizations to perform in-depth analysis and uncover meaningful insights from their data.
Conclusion
Empowering Data-Driven Success
The migration from Apptio to Tableau not only empowers organizations with advanced data visualization and integration capabilities but also supercharges their analytical prowess, paving the way for smarter decision-making and data-driven success.
